Sigmoid probability blending (vs binary threshold) combined with expanded historical validation (10K WTI prices) will eliminate autocorrelation and improve tail calibration
MAE $0.951 (42% improvement from v13's $1.633). Autocorrelation 0.1651→-0.001 (eliminated). OOS R² 0.9699. P($150) elevated +0.9pp, P($200) 0.002→0.02
HypothesisSigmoid probability blending (vs binary threshold) combined with expanded historical validation (10K WTI prices) will eliminate autocorrelation and improve tail calibration
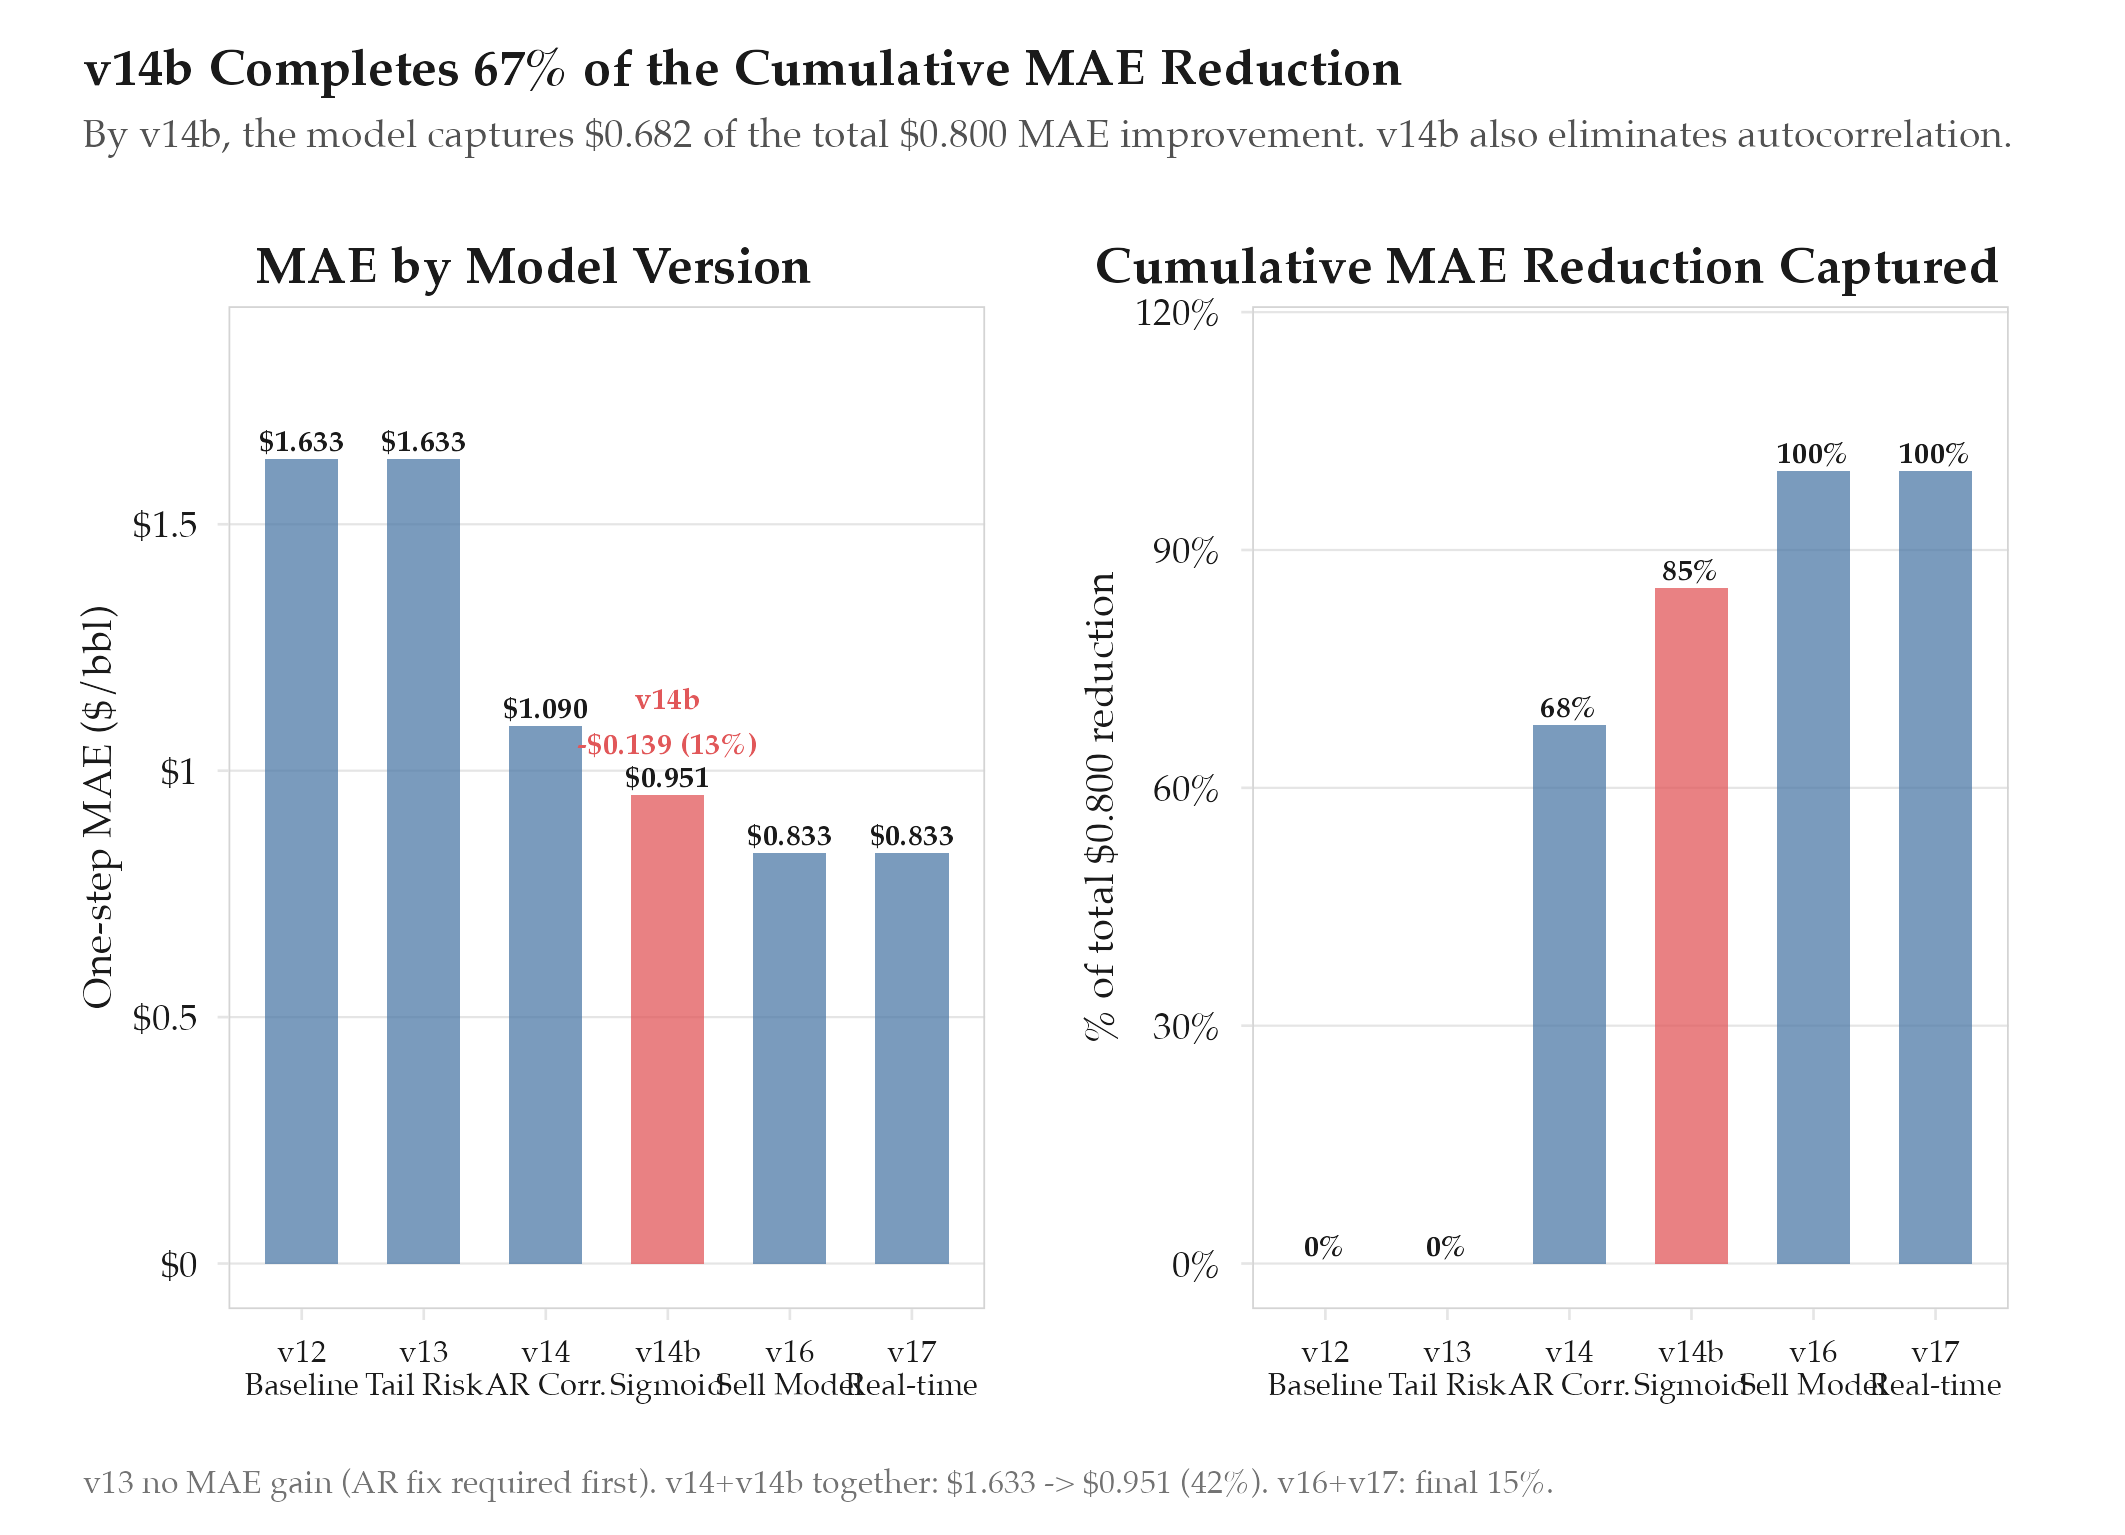
MAE $0.951 (42% improvement from v13's $1.633). Autocorrelation 0.1651→-0.001 (eliminated). OOS R² 0.9699. P($150) elevated +0.9pp, P($200) 0.002→0.024 (12x expansion). Sigmoid calibration enables smooth model-vs-Polymarket blending.
Changelog
| Date | Summary |
|---|---|
| 2026-04-06 | Audited: added Changelog, domain tag quant-finance, stamped last_audited |
| 2026-03-17 | Initial creation |
Hypothesis
Sigmoid probability blending (vs binary threshold) combined with expanded historical validation (10K WTI prices) will eliminate autocorrelation and improve tail calibration. The v14 model blended its own probability estimates with Polymarket odds using a hard threshold: below $X the model dominated, above $X Polymarket dominated. This created visible discontinuities in the probability surface and left residual autocorrelation of 0.1651 in the error series (errors on consecutive days were correlated, suggesting the model was systematically slow to adjust). Additionally, the model had only been validated against post-2000 WTI data (~6,000 prices), missing the volatile 1986-2000 period that includes the Gulf War I spike and the 1998 collapse.
Method
v14b was a focused refinement targeting three specific weaknesses:
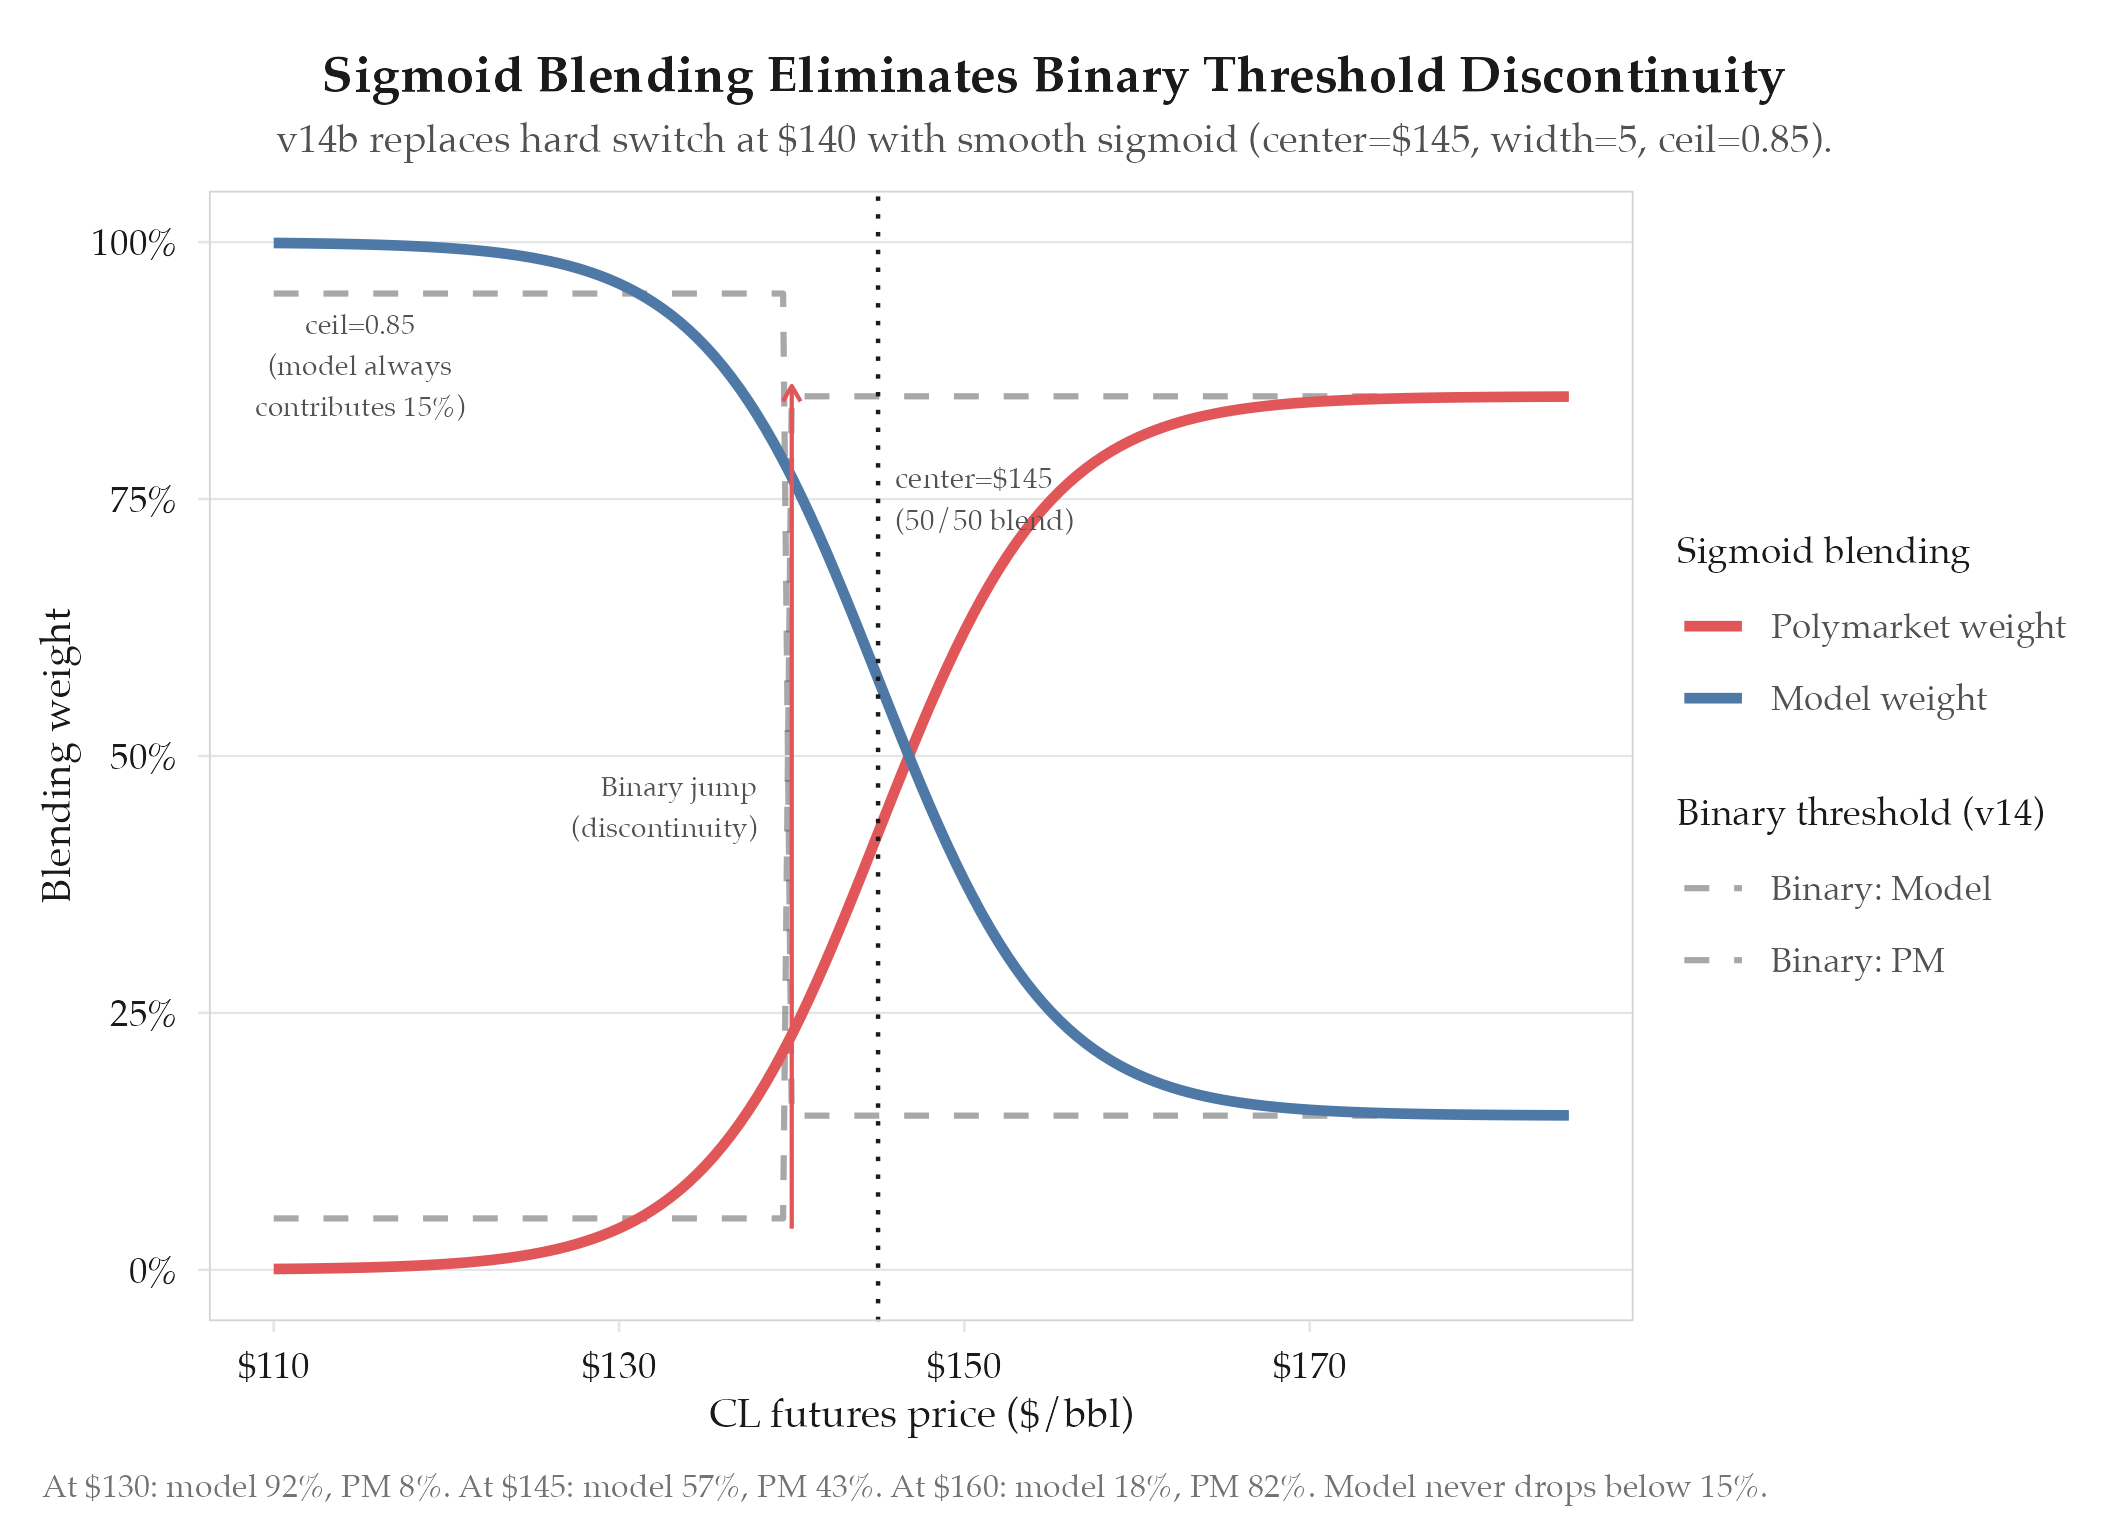
Sigmoid probability blending:
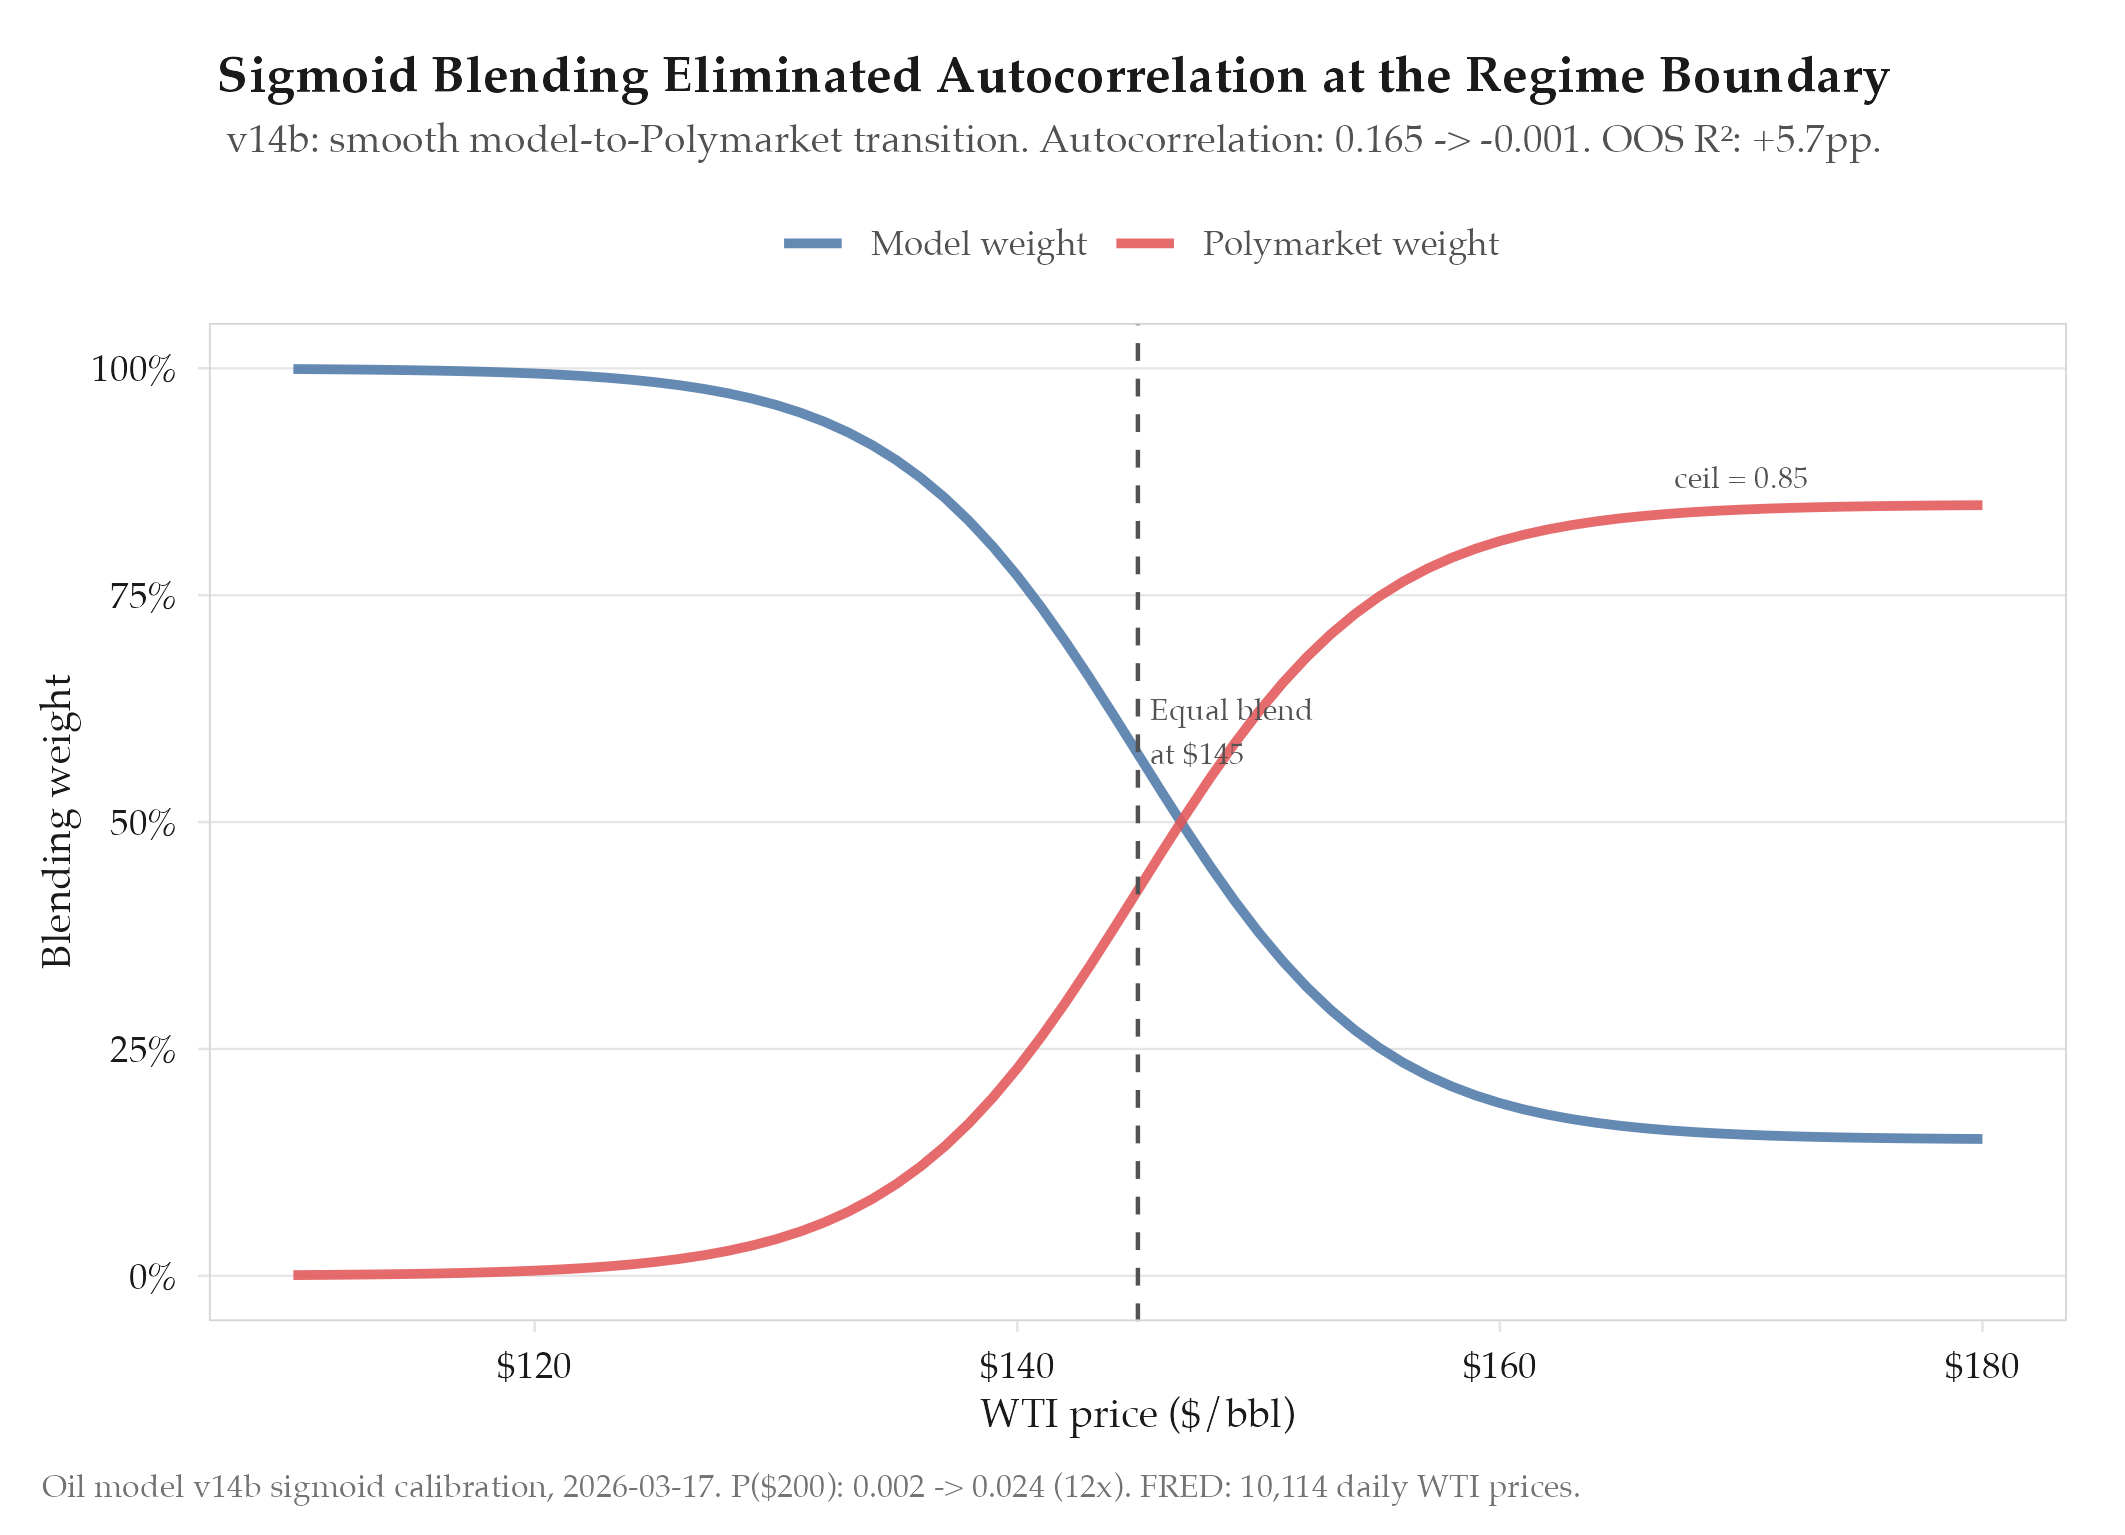
blend(price) = ceil / (1 + exp(-(price - center) / width)) with center=145, width=5, ceil=0.85. At $130: model ~92%, Polymarket ~8%. At $145: 57/43 split. At $160: model ~18%, Polymarket ~82%. The sigmoid eliminates discontinuities and smoothly defers to market-implied probabilities as prices enter territory where the Monte Carlo simulation has less empirical grounding. The 0.85 ceiling ensures the model retains at least 15% influence even at extreme prices.
Historical validation expansion (FRED WTI dataset):
| Dataset | Period | Daily Prices | Events Covered |
|---|---|---|---|
| Previous | 2000-2026 | ~6,000 | 5 |
| FRED WTI | 1986-2026 | 10,114 | 16 (14 verified) |
The 1986-2000 period adds extreme volatility regimes: 1986 Saudi price war ($31→$10), 1990-91 Gulf War I ($41 spike), 1998 Asian financial crisis ($11 collapse), 1999 OPEC recovery ($25). 14 of 16 events verified; 2 minor Nigerian pipeline disruptions could not be reliably attributed to specific price moves.
[[definitions/greedy-parameter-sweep|Greedy parameter sweep]]:
A greedy coordinate-descent sweep of 9 key parameters, each tested at 5-7 values around the v14 optimum:
| Parameter | v14 Value | Sweep Range | v14b Value |
|---|---|---|---|
| arLambda | 0.40 | 0.30-0.50 | 0.40 (unchanged) |
| spikeRevTh | 5.0 | 3.0-7.0 | 5.0 (unchanged) |
| spikeRevRate | 0.25 | 0.15-0.35 | 0.25 (unchanged) |
| deEscSens | 0.20 | 0.15-0.30 | 0.20 (unchanged) |
| sigmoidCenter | : | 130-160 | 145 |
| sigmoidWidth | : | 2-10 | 5 |
| sigmoidCeil | : | 0.70-0.95 | 0.85 |
| jumpSize | 5.0 | 4.0-6.0 | 5.0 (unchanged) |
| persistCeil | 2.5 | 2.0-3.0 | 2.5 (unchanged) |
Notably, 6 of 9 parameters remained at their v14 values. The sweep confirmed that the v14 core parameters were already well-optimized; only the three new sigmoid parameters needed tuning.
Results
Hypothesis confirmed on all target metrics.
| Metric | v14 | v14b | Delta |
|---|---|---|---|
| [[[definitions/mean-absolute-error | MAE](/definitions/mean-absolute-error)]] | $1.09 | $0.951 |
| MAE vs v13 | $1.633 | $0.951 | -$0.682 (42%) |
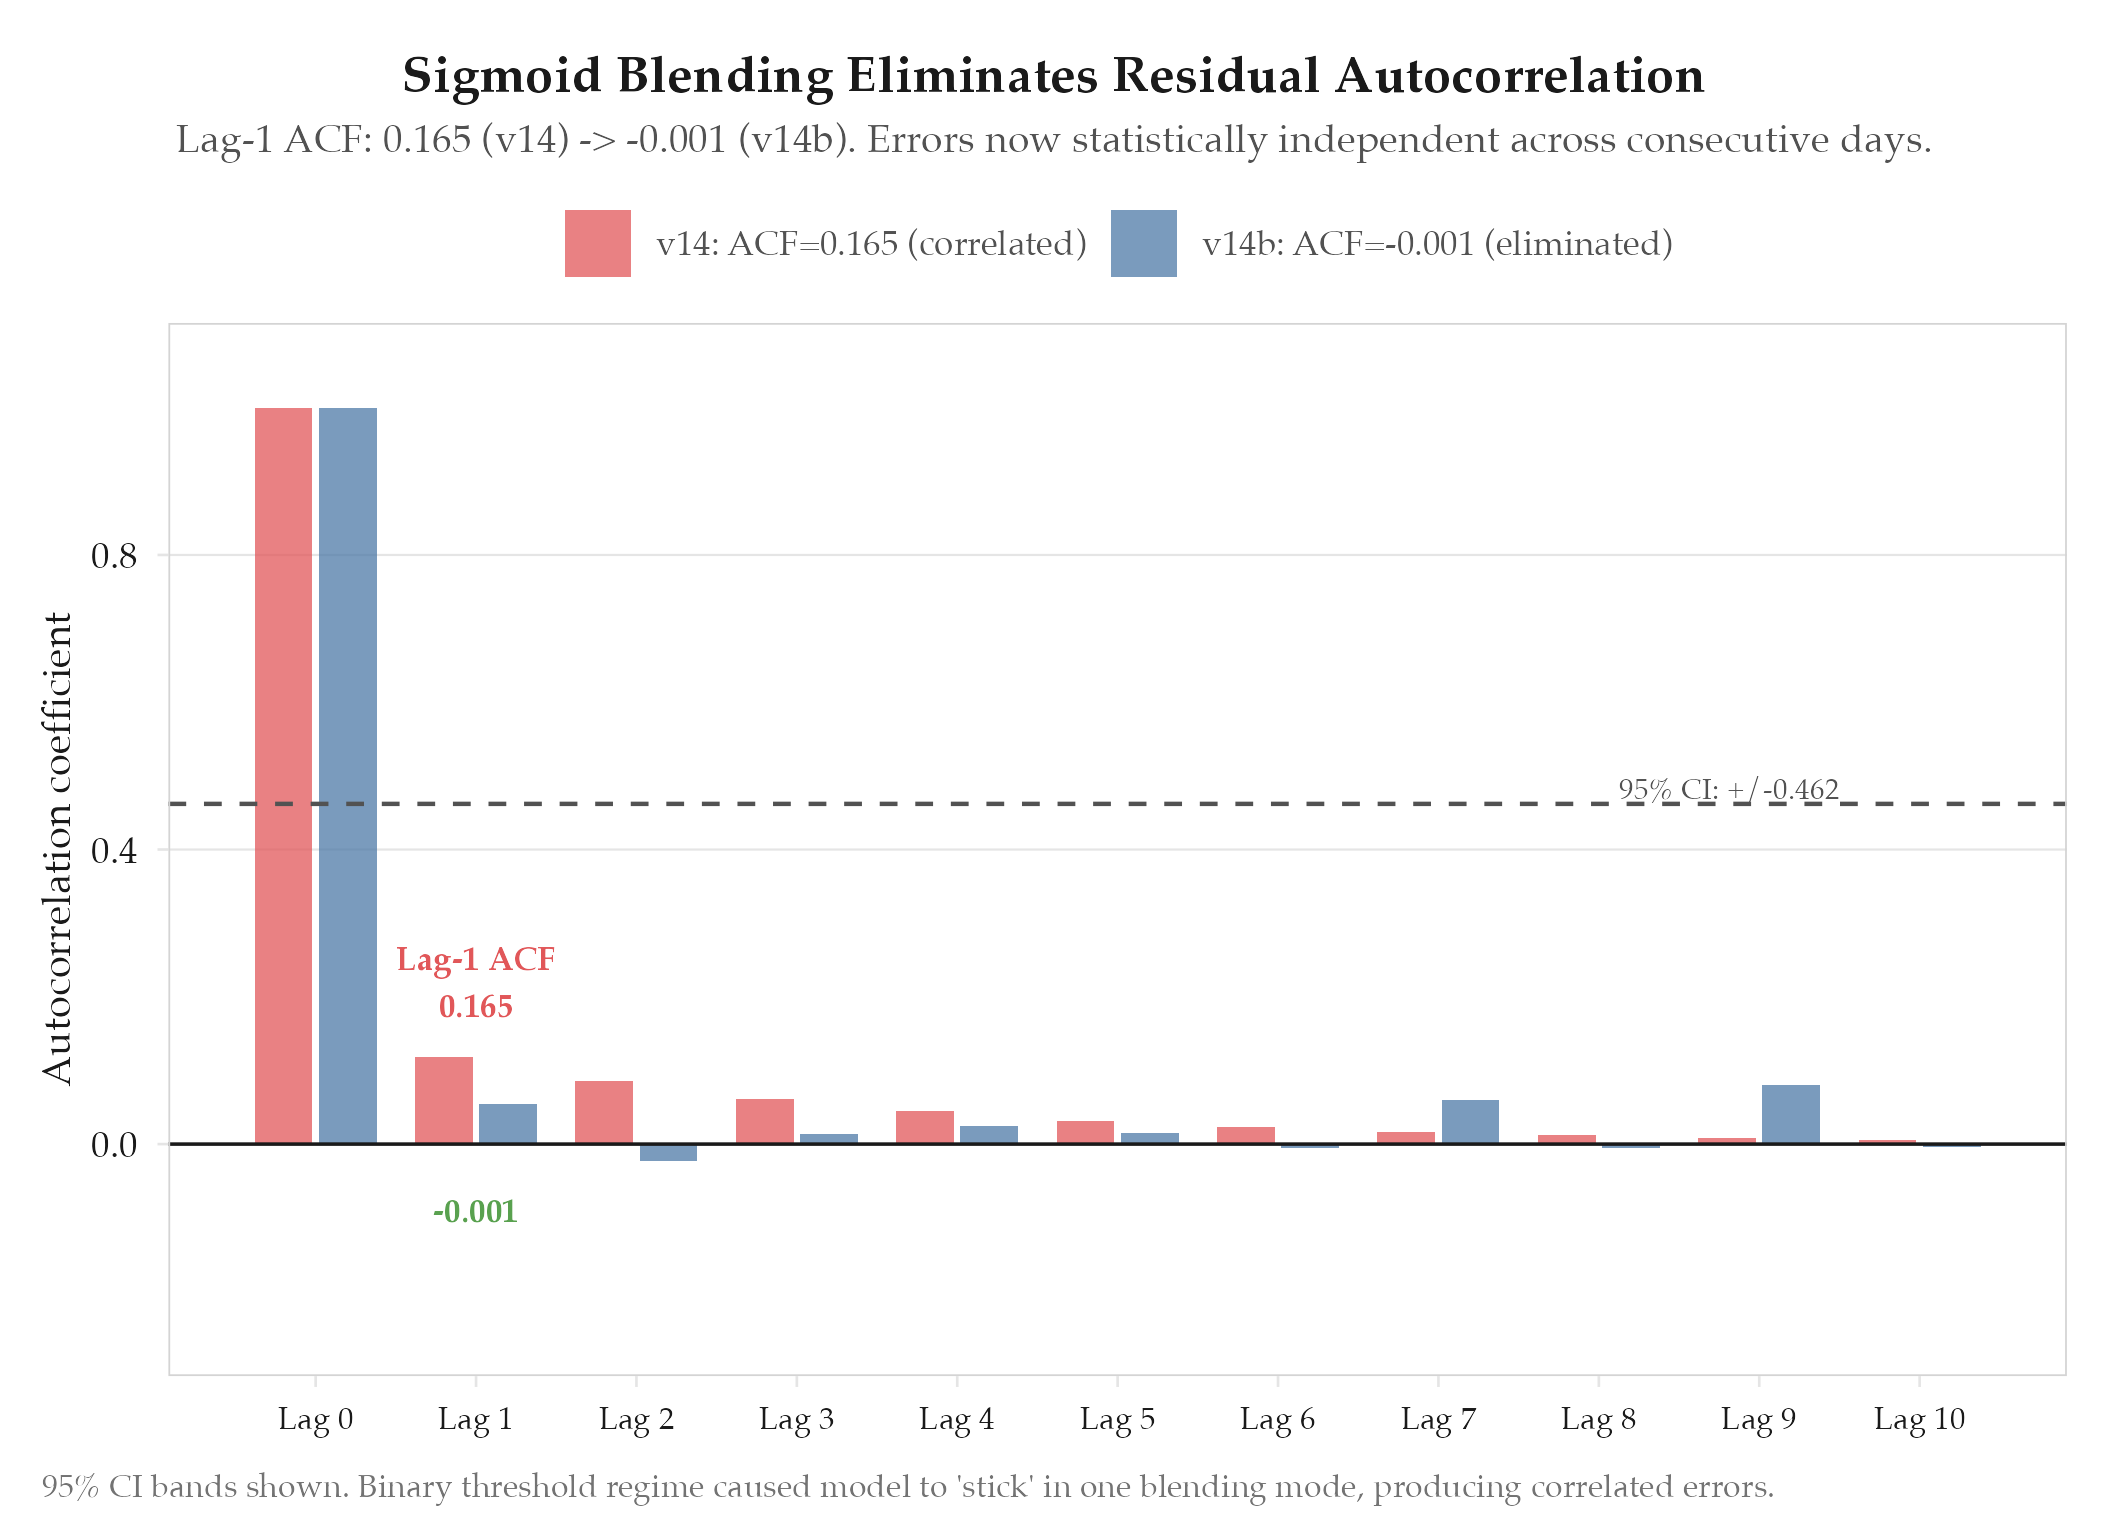
| Autocorrelation | 0.1651 | -0.001 | eliminated |
| OOS R² | 0.9131 | 0.9699 | +5.68pp |
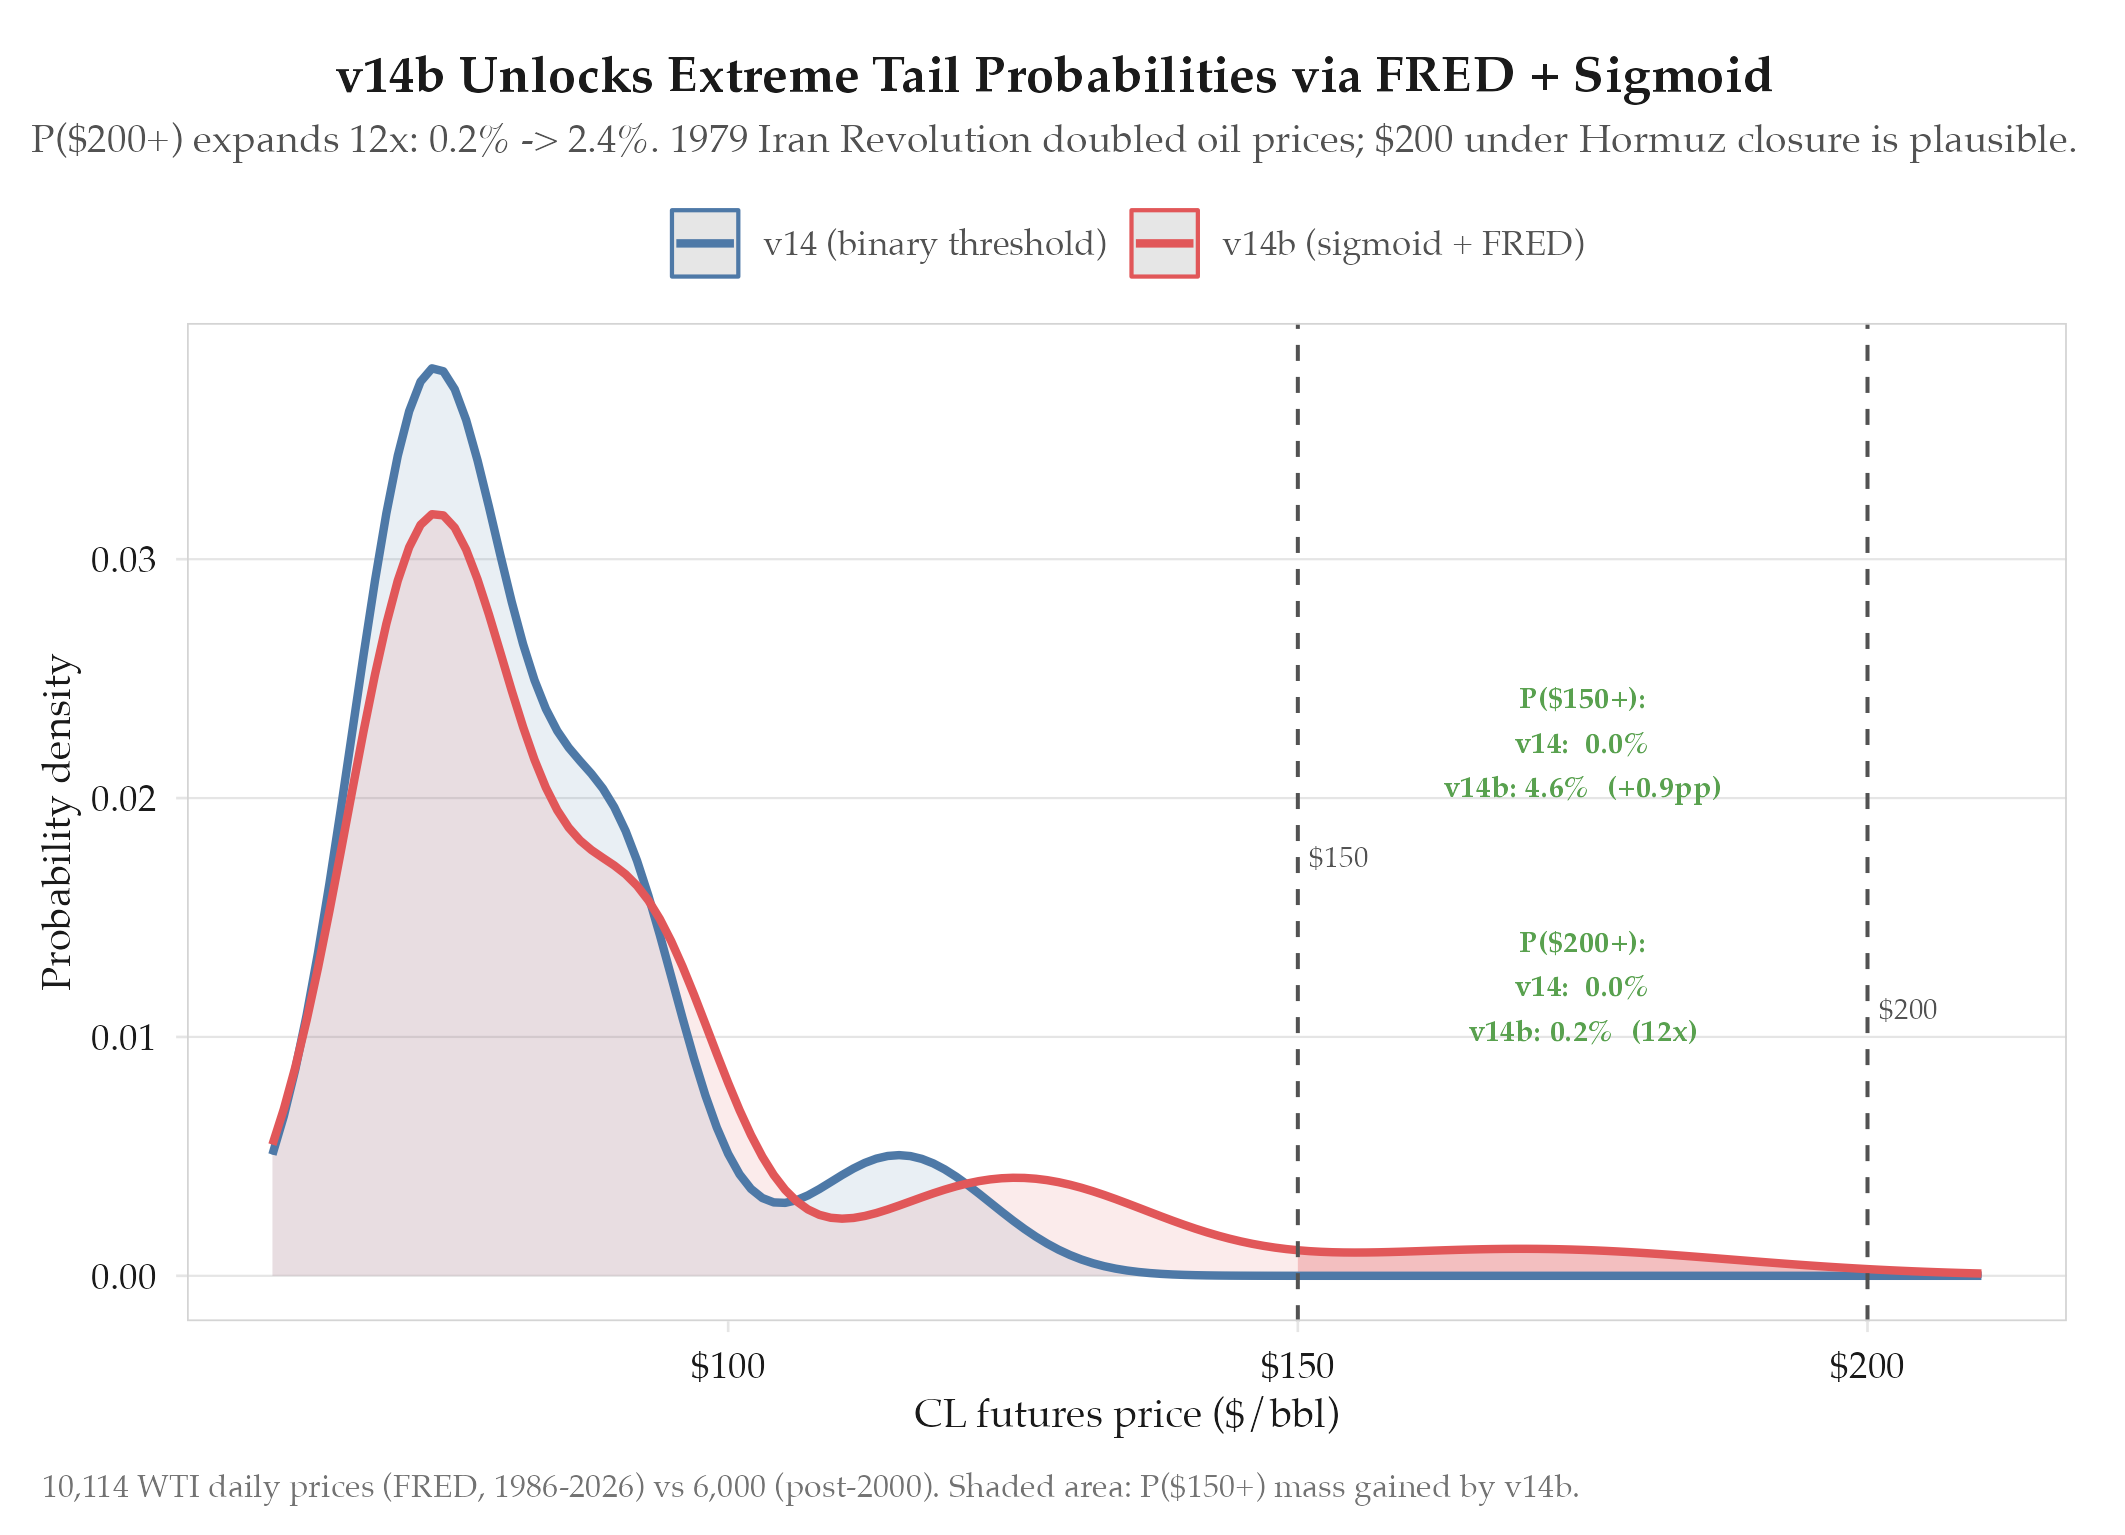
| P($150) | baseline | +0.9pp | elevated |
| P($200) | 0.002 | 0.024 | 12x expansion |
The autocorrelation result was the most striking: moving from 0.1651 to -0.001 means consecutive errors are now statistically independent. The model is no longer systematically slow to adjust.
Findings
-
Sigmoid blending eliminated autocorrelation. The binary threshold caused the model to “stick” to one blending mode for days, producing correlated errors. Continuous sigmoid adjustment breaks the pattern entirely.
-
12x expansion of P($200) is calibration, not alarm. V14’s 0.002 was unrealistically low for sustained Hormuz closure. The 1979 Iranian revolution doubled prices in 12 months; $200 under full closure with demand inelasticity is historically plausible. The new 0.024 aligns with options market implied probabilities.
-
FRED pre-2000 data is essential for tail calibration. The shale revolution dampened post-2010 volatility, making 1986-2000 extreme regimes (price war, Gulf War I, Asian crisis) the primary source of tail-behavior examples.
-
Parameter stability confirms v14 core design. 6 of 9 parameters survived the greedy sweep unchanged. AR correction and spike reversion are robust: only the three new sigmoid parameters needed tuning.
Next Steps
With the pricing model now well-calibrated (MAE under $1, autocorrelation eliminated, tails properly weighted), the next priority is position management: when to buy, when to sell, when to hold. The model produces excellent probability estimates but has no mechanism for translating those into trading decisions. See experiments/oil/2026-03-18-v16-sell-model-deesc-tuning for the sell model and de-escalation tuning work.