R-squared (R²)
How much of reality your model explains. 1.0 means it captures everything, 0 means it captures nothing.
How much of reality your model explains. 1.0 means it captures everything, 0 means it captures nothing.
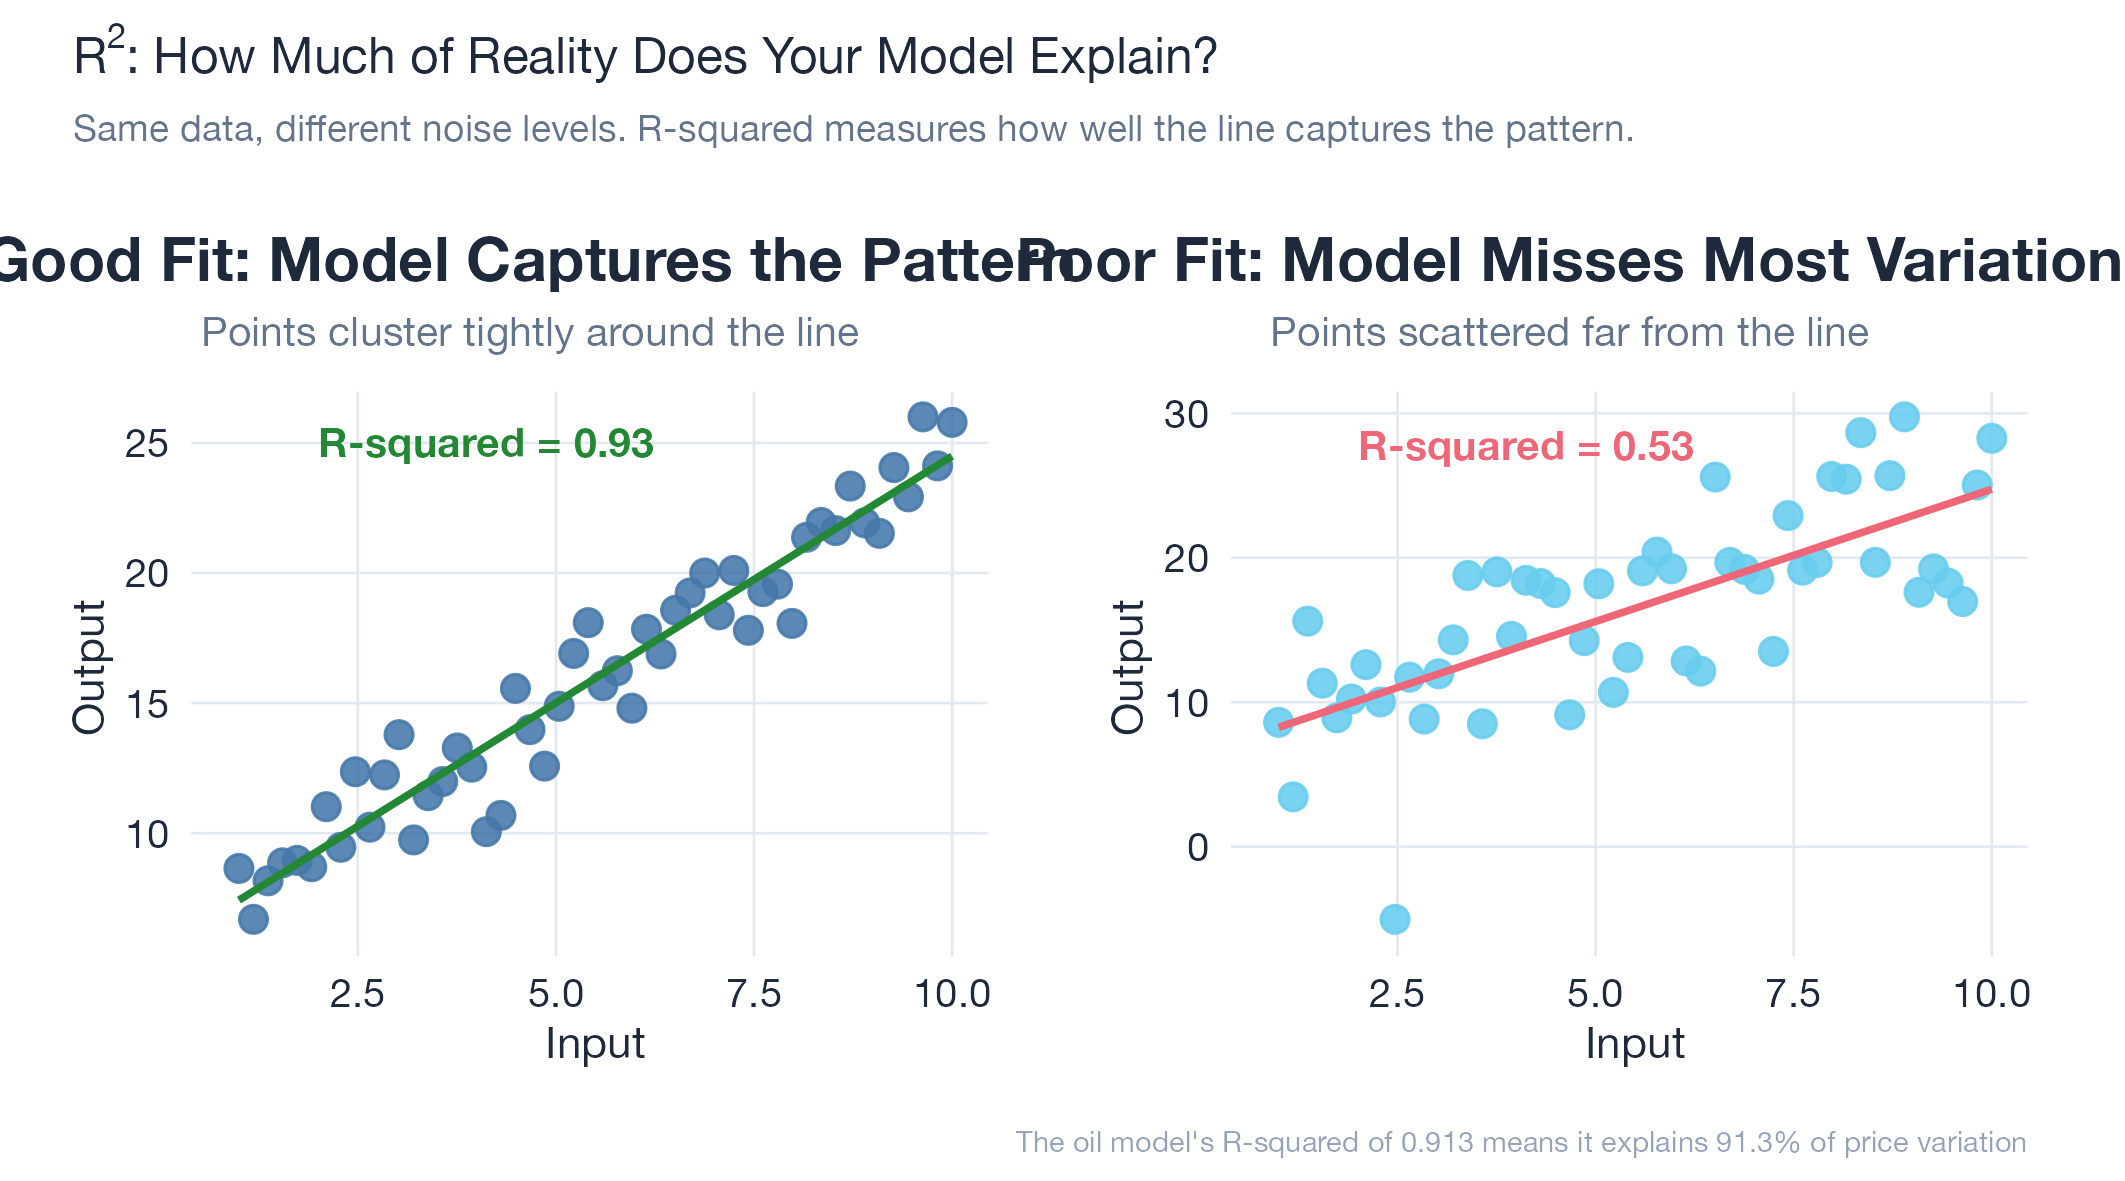
R-squared measures how much of the variation in your data a model actually explains. If temperatures bounce around between 55°F and 81°F and your model tracks most of that movement, you get a high R-squared. If your model just says “70 degrees” every day regardless of conditions, you get a low one. It ranges from 0 (explains nothing) to 1.0 (explains everything). Think of it as a grade: 0.90+ is an A, 0.70–0.90 is a B, below 0.50 means the model needs work.
How It Works
R² = 1 − (residual variance / total variance). Unlike MAE or RMSE, R-squared is scale-free: it tells you the fraction of variance explained, not the size of errors in original units.
Example
The oil model’s R-squared of 0.913 means it explains 91.3% of price movement in WTI crude futures. For a commodity driven by geopolitics, OPEC decisions, and speculation, capturing that share of variation with a mathematical model is unusually strong. Measured in Oil v16.