Monte Carlo Simulation
Run thousands of random scenarios to map the range of possible outcomes. Dice rolls for decisions.
Run thousands of random scenarios to map the range of possible outcomes. Dice rolls for decisions.
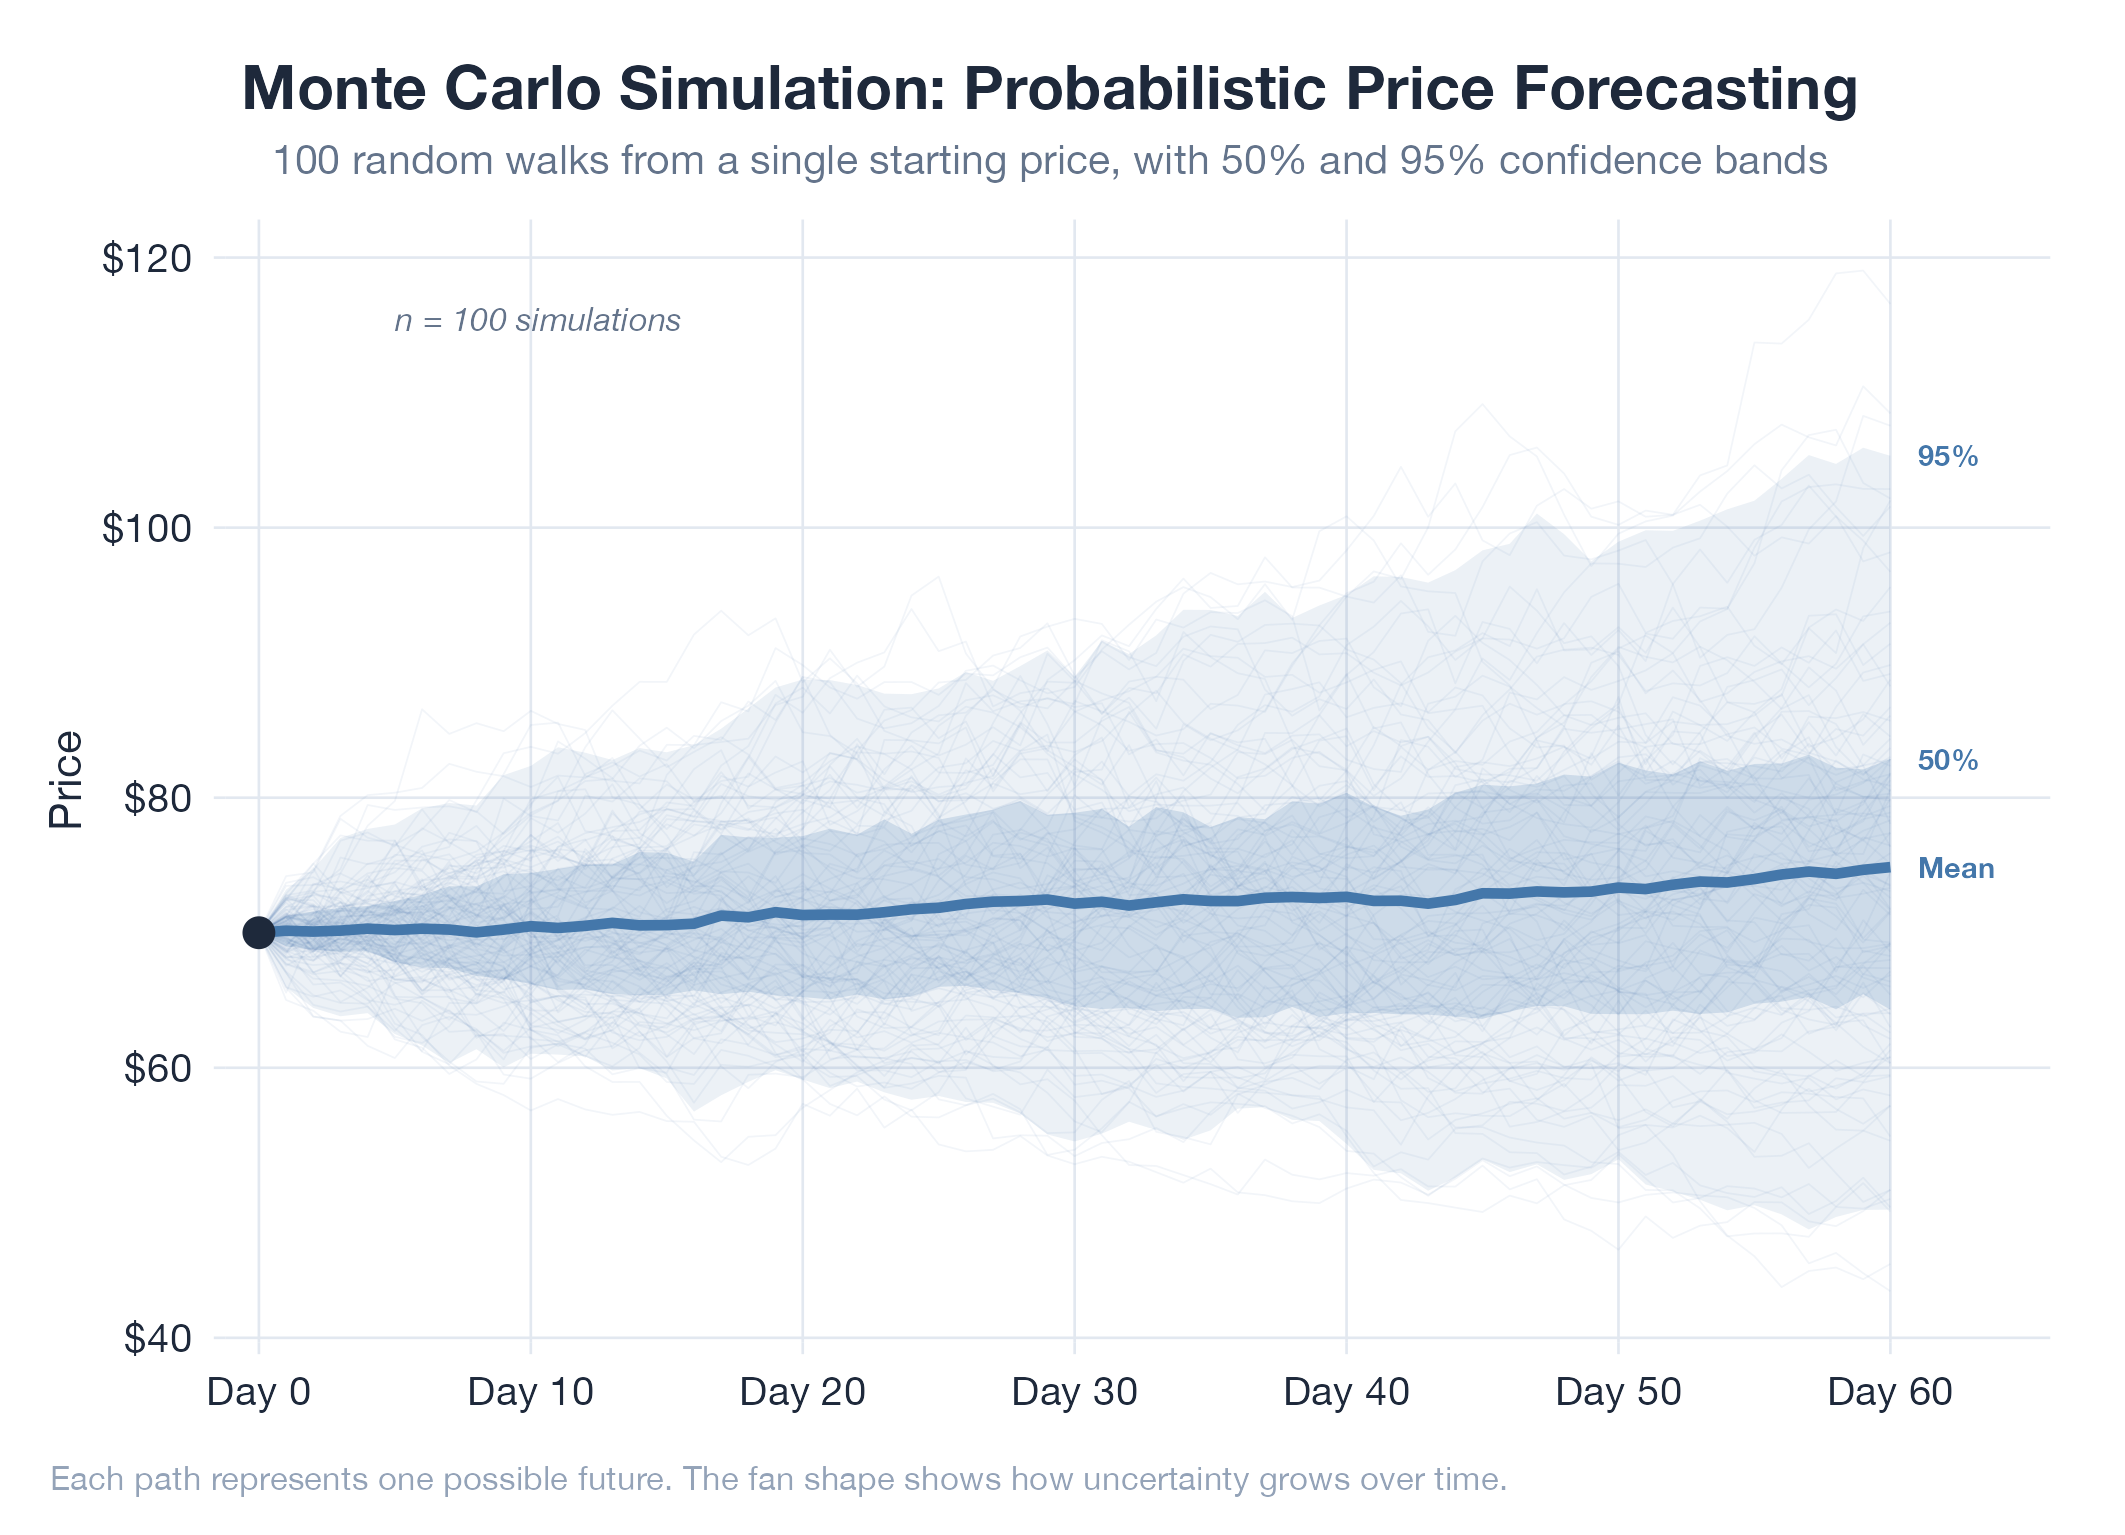
Monte Carlo simulations replace single-point estimates with a full probability distribution by running thousands of randomized scenarios. Define your inputs and their uncertainty (each has a probability distribution), randomly sample from those distributions thousands of times, compute the output for each run, then analyze the resulting distribution of outcomes. The median gives you the most likely result. The 5th percentile shows how bad things can get. The spread shows how uncertain you should be. Named after the Monaco casino, it uses randomness as a computational tool.
How It Works
Define input distributions → run N trials (each sampling randomly) → collect N outputs → compute statistics on the output distribution. Power comes from capturing interactions between variables that analytical formulas can’t handle.
Example
The oil model runs Monte Carlo with 7 ratcheted parameters to generate probability distributions for WTI crude futures. These feed CVaR calculations and sell triggers. The v16 model achieved R² 0.913 and MAPE 2.26% after 34 days of forward testing. Time window specifically calibrated for April PM market dynamics. Details in Oil v16.