Volatility
How much a price bounces around. High volatility means big swings, not just big losses.
How much a price bounces around. High volatility means big swings, not just big losses.
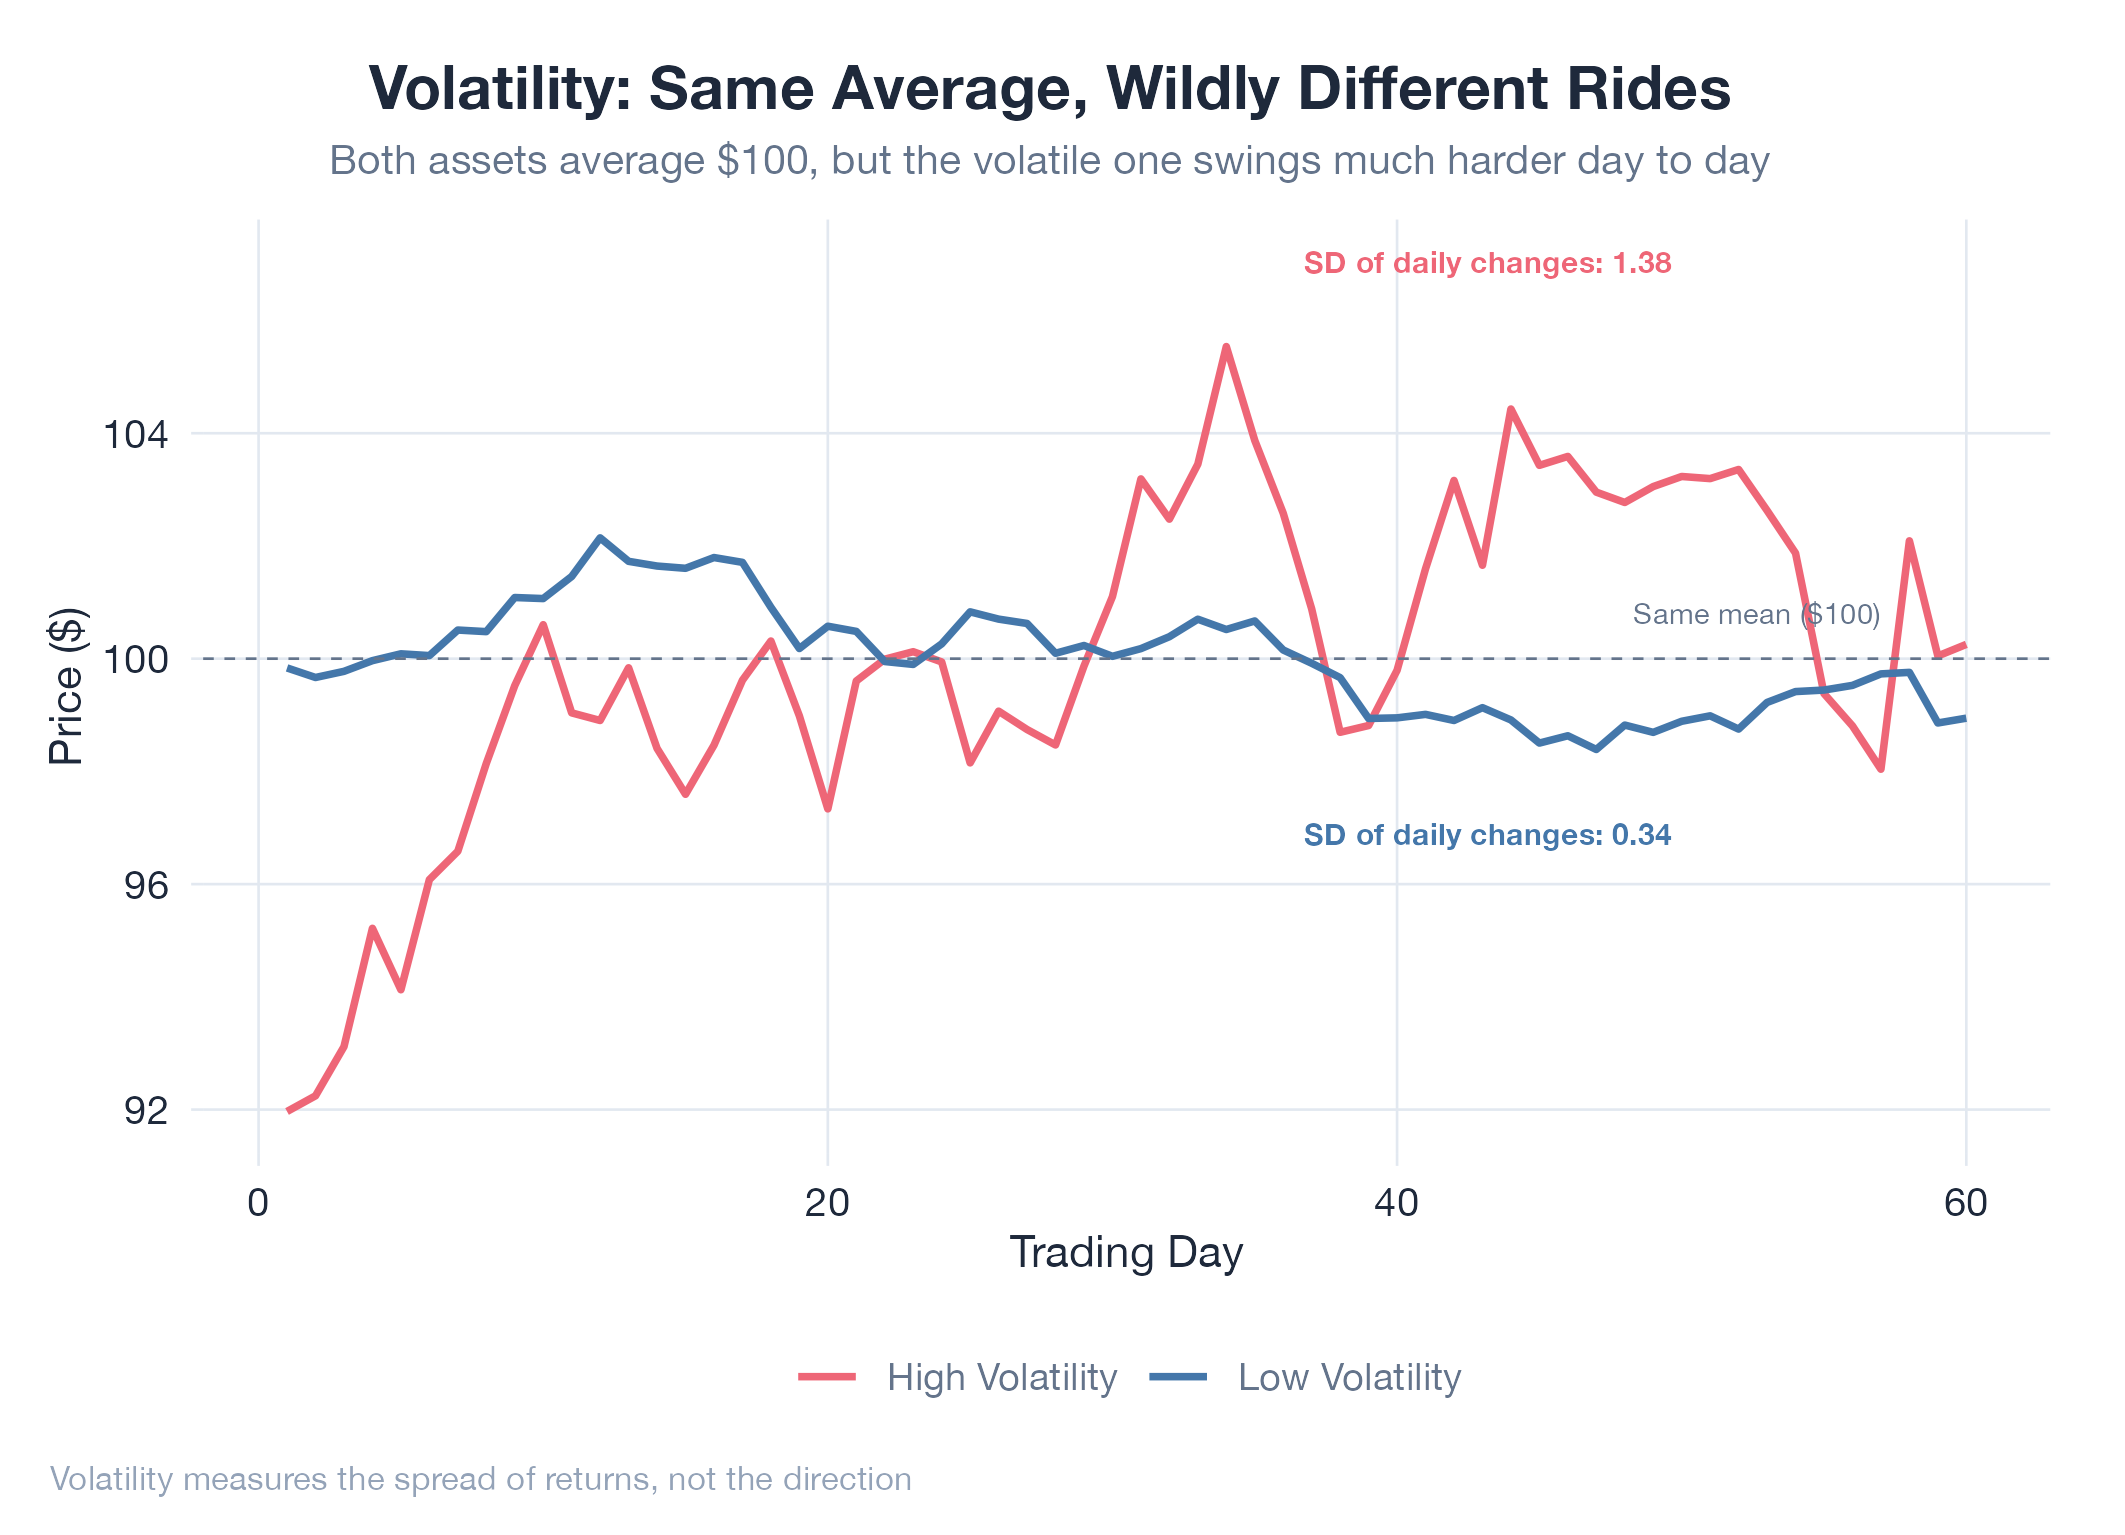
Volatility is the standard deviation of returns over a period: it measures how far prices tend to deviate from their average movement, not just whether they go up or down. A stock returning +30%, −25%, +15%, −20% and landing at +10% is just as volatile as one doing the opposite; volatility captures the size of swings, not their direction. Key properties: volatility clusters (high-vol days follow high-vol days), it’s mean-reverting (extremes don’t last forever), and annualized 20% roughly means prices stay within a 20% band two-thirds of the time.
How It Works
Historical volatility = standard deviation of daily returns, annualized (multiply daily σ by √252). Implied volatility is reverse-engineered from options prices: it represents the market’s forward-looking expectation of future swings.
Example
WTI crude oil typically has 25–45% annualized volatility, spiking above 80% during geopolitical crises. The oil model’s sell triggers adjust dynamically: wider stops in high-vol regimes, tighter stops in calm markets. The v13 tail risk recalibration directly addressed divergence between implied and realized volatility. Detailed in Oil v13 Tail Risk.