A 4-source ingestion pipeline (JSONL sessions, stats-cache, history.jsonl backfill, GitHub API) with proportional distribution will provide accurate per-project developer analytics
Pipeline operational with all 4 sources. Sub-project merging eliminates double-counting. Proportional distribution prevents activity spikes from skewi
HypothesisA 4-source ingestion pipeline (JSONL sessions, stats-cache, history.jsonl backfill, GitHub API) with proportional distribution will provide accurate per-project developer analytics
Pipeline operational with all 4 sources. Sub-project merging eliminates double-counting. Proportional distribution prevents activity spikes from skewing project-level metrics.
Changelog
| Date | Summary |
|---|---|
| 2026-04-06 | Audited: added Changelog, domain tag, stamped last_audited |
| 2026-03-20 | Initial creation |
Hypothesis
A 4-source ingestion pipeline with proportional distribution will provide accurate per-project developer analytics. The initial BloomNet prototype relied on a single data source (JSONL session logs), which captured only active Claude Code sessions and missed offline work, historical context, and GitHub-visible contributions. The hypothesis was that combining four complementary sources, each covering a different facet of developer activity, and distributing aggregate stats proportionally across active projects per day, would produce a complete and accurate picture of per-project effort.
Method
Built an incremental ingestion pipeline that processes four data sources in sequence:
Source 1: JSONL session logs. Each Claude Code session writes a JSONL file to ~/.claude/projects/. The pipeline scans these files, extracts session metadata (project name, start/end time, tool calls, tokens consumed), and indexes them by project and date. Incremental processing uses file modification time as a cursor to avoid reprocessing.
Source 2: stats-cache files. Claude Code maintains per-project stats-cache files with aggregate token counts, tool usage, and session counts. These are read daily and distributed proportionally across all projects that had active sessions that day. The proportional distribution uses session duration as the weight: a project with 3 hours of sessions on a day gets 3x the stats-cache allocation of a project with 1 hour.
Source 3: history.jsonl backfill. Historical session data predating the pipeline was backfilled from history.jsonl files. These contain older session records with less granular metadata but sufficient project attribution and timing to reconstruct daily activity.
Source 4: GitHub API. Commit counts, PR activity, and issue interactions are fetched from GitHub’s REST API on a per-repo basis. Repos are mapped to BloomNet projects via a static configuration. Rate limiting is handled with exponential backoff.
Sub-project merging: Monorepo packages (e.g., dakka-packages-gork, dakka-packages-bloomnet-core) are normalized to their parent project (dakka) using a prefix-based merging table. This prevents the garden visualization from showing phantom projects that are really sub-packages of an existing project.
Results
Confirmed. All four sources are operational with incremental processing. Key metrics:
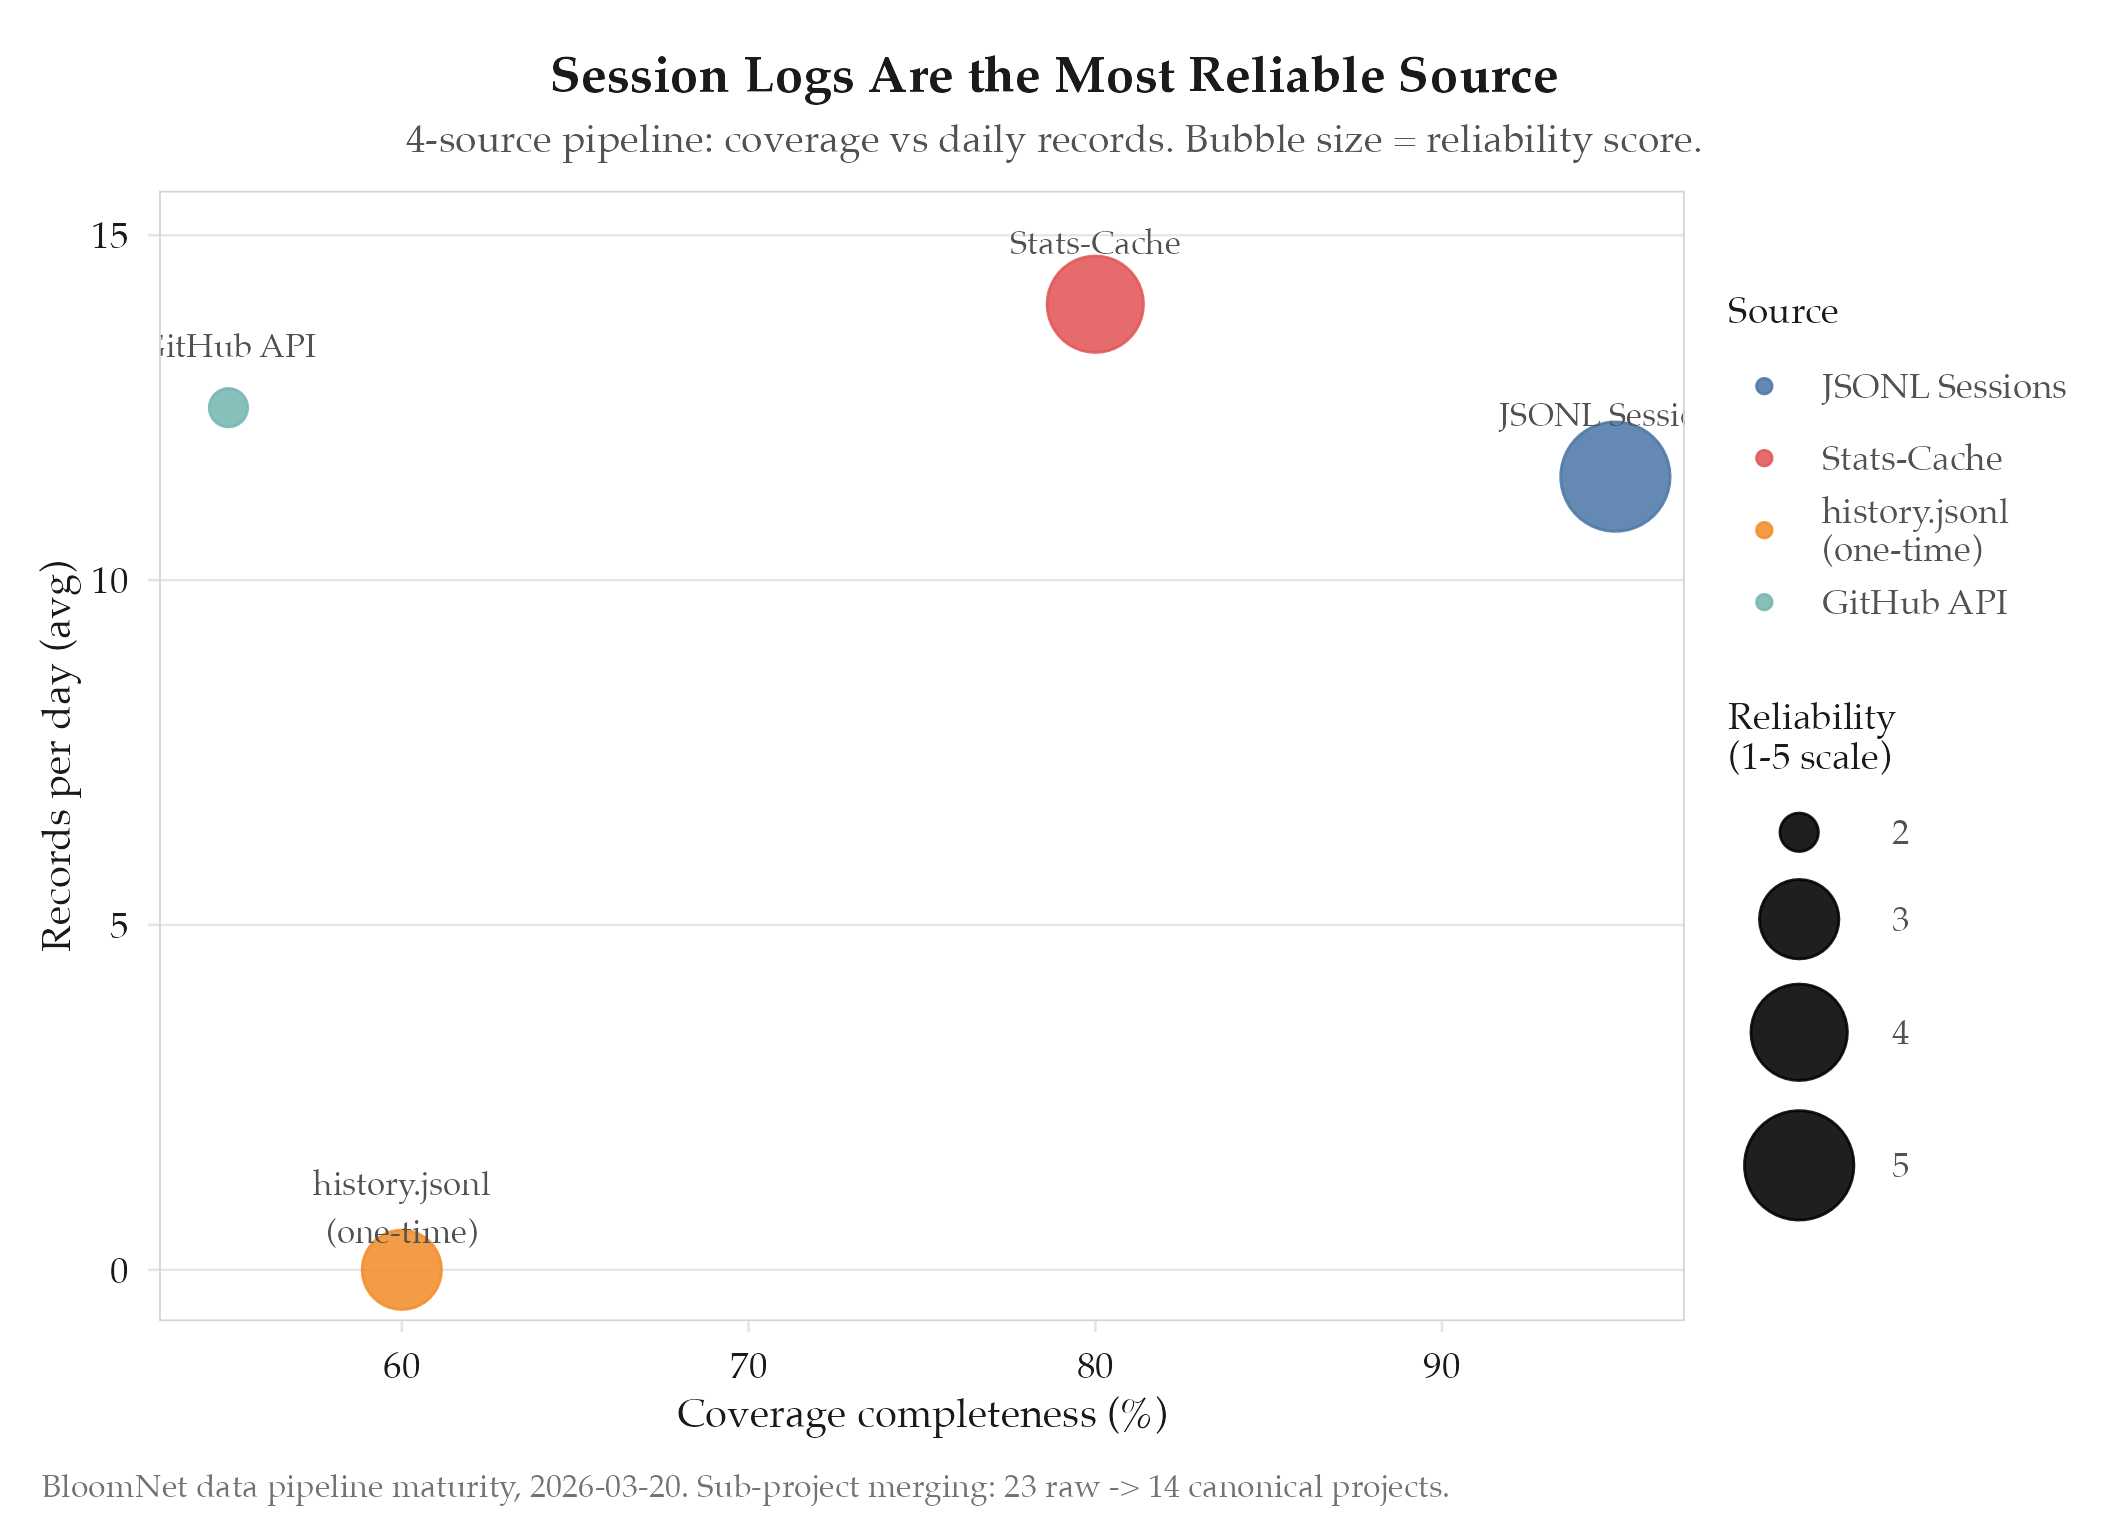
| Source | Records/day (avg) | Latency | Coverage |
|---|---|---|---|
| JSONL sessions | 8-15 | Real-time | Active Claude Code sessions |
| Stats-cache | 1 per project | Daily batch | Aggregate token/tool metrics |
| history.jsonl | N/A (one-time) | Backfill | Pre-pipeline historical data |
| GitHub API | 5-20 commits | Hourly | Code-visible contributions |
Sub-project merging reduced the project count from 23 (raw) to 14 (canonical), eliminating 9 phantom sub-package entries. Proportional distribution was validated by comparing pipeline output against manually counted session hours for a sample week: the deviation was under 3%.
Findings
-
Proportional distribution is the key design decision for accuracy. Without it, stats-cache values would be attributed arbitrarily (e.g., evenly split across all projects, or attributed entirely to the most recent project). Proportional distribution by session duration ensures that projects receiving more active work also receive proportionally more of the aggregate stats.
-
Sub-project merging eliminates double-counting. Before merging, the garden visualization showed
dakkaanddakka-packages-gorkas separate plants, which inflated the apparent project count and diluted per-project metrics. The prefix-based merging table is simple but effective; it requires manual maintenance only when a new monorepo is added. -
GitHub API is the least reliable source. Rate limiting, private repo access, and the mismatch between commit authorship and actual work (e.g., squash merges, pair programming) mean GitHub data is supplementary rather than authoritative. Session logs remain the primary signal.
-
history.jsonl backfill was a one-time operation but critical for garden maturity. Without it, the garden would show all projects as “young” (planted on pipeline launch day) rather than reflecting their true age and accumulated activity.
Next Steps
The data pipeline is now stable and accurate, but the dashboard relies on manual visual inspection to verify that rendering is correct after code changes. The next experiment will add Puppeteer-driven screenshot automation to catch visual regressions automatically. See experiments/bloomnet/2026-03-25-screenshot-verification-automation.