Tail risk is vastly underestimated: adding historical analogues and de-escalation mechanics will improve out-of-sample fit
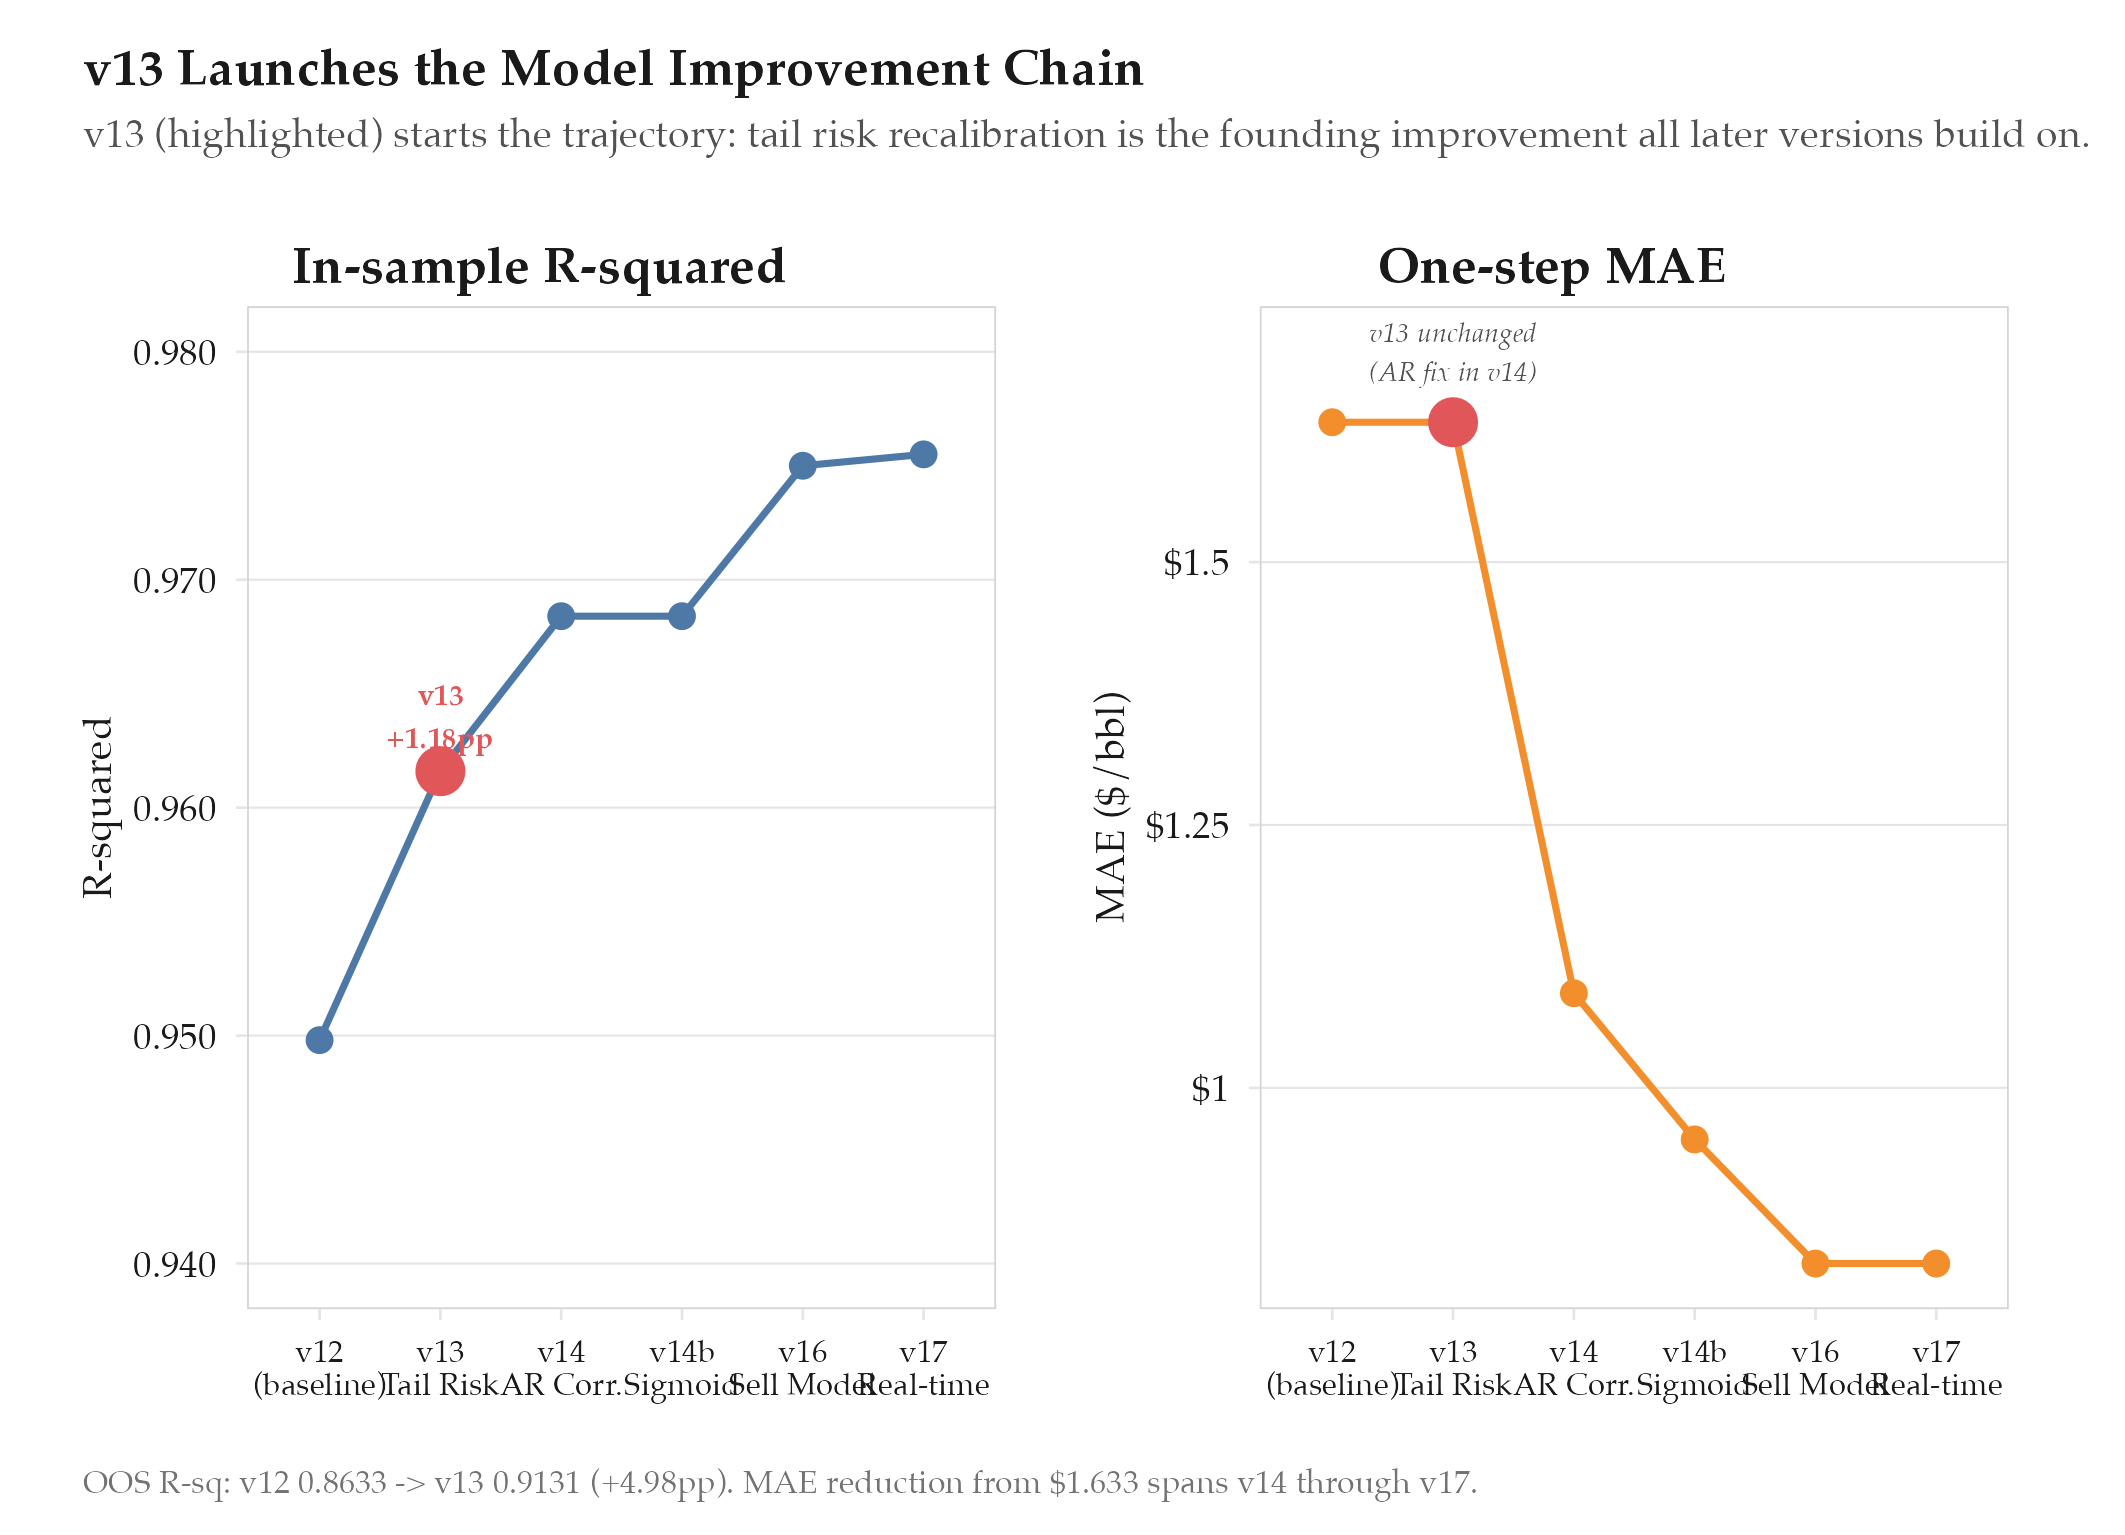
R² 0.9498→0.9616 (+1.18pp). MAPE 1.97%→1.89%. OOS R² 0.8633→0.9131 (+4.98pp). P($120+) 15.4%→36.4%. Historical pass rate 0/5→5/8. Brier vs Polymarket
HypothesisTail risk is vastly underestimated: adding historical analogues and de-escalation mechanics will improve out-of-sample fit
R² 0.9498→0.9616 (+1.18pp). MAPE 1.97%→1.89%. OOS R² 0.8633→0.9131 (+4.98pp). P($120+) 15.4%→36.4%. Historical pass rate 0/5→5/8. Brier vs Polymarket +1.28pp.
Changelog
| Date | Summary |
|---|---|
| 2026-04-06 | Audited: added Changelog, domain tag quant-finance, stamped last_audited |
| 2026-03-16 | Initial creation |
Hypothesis
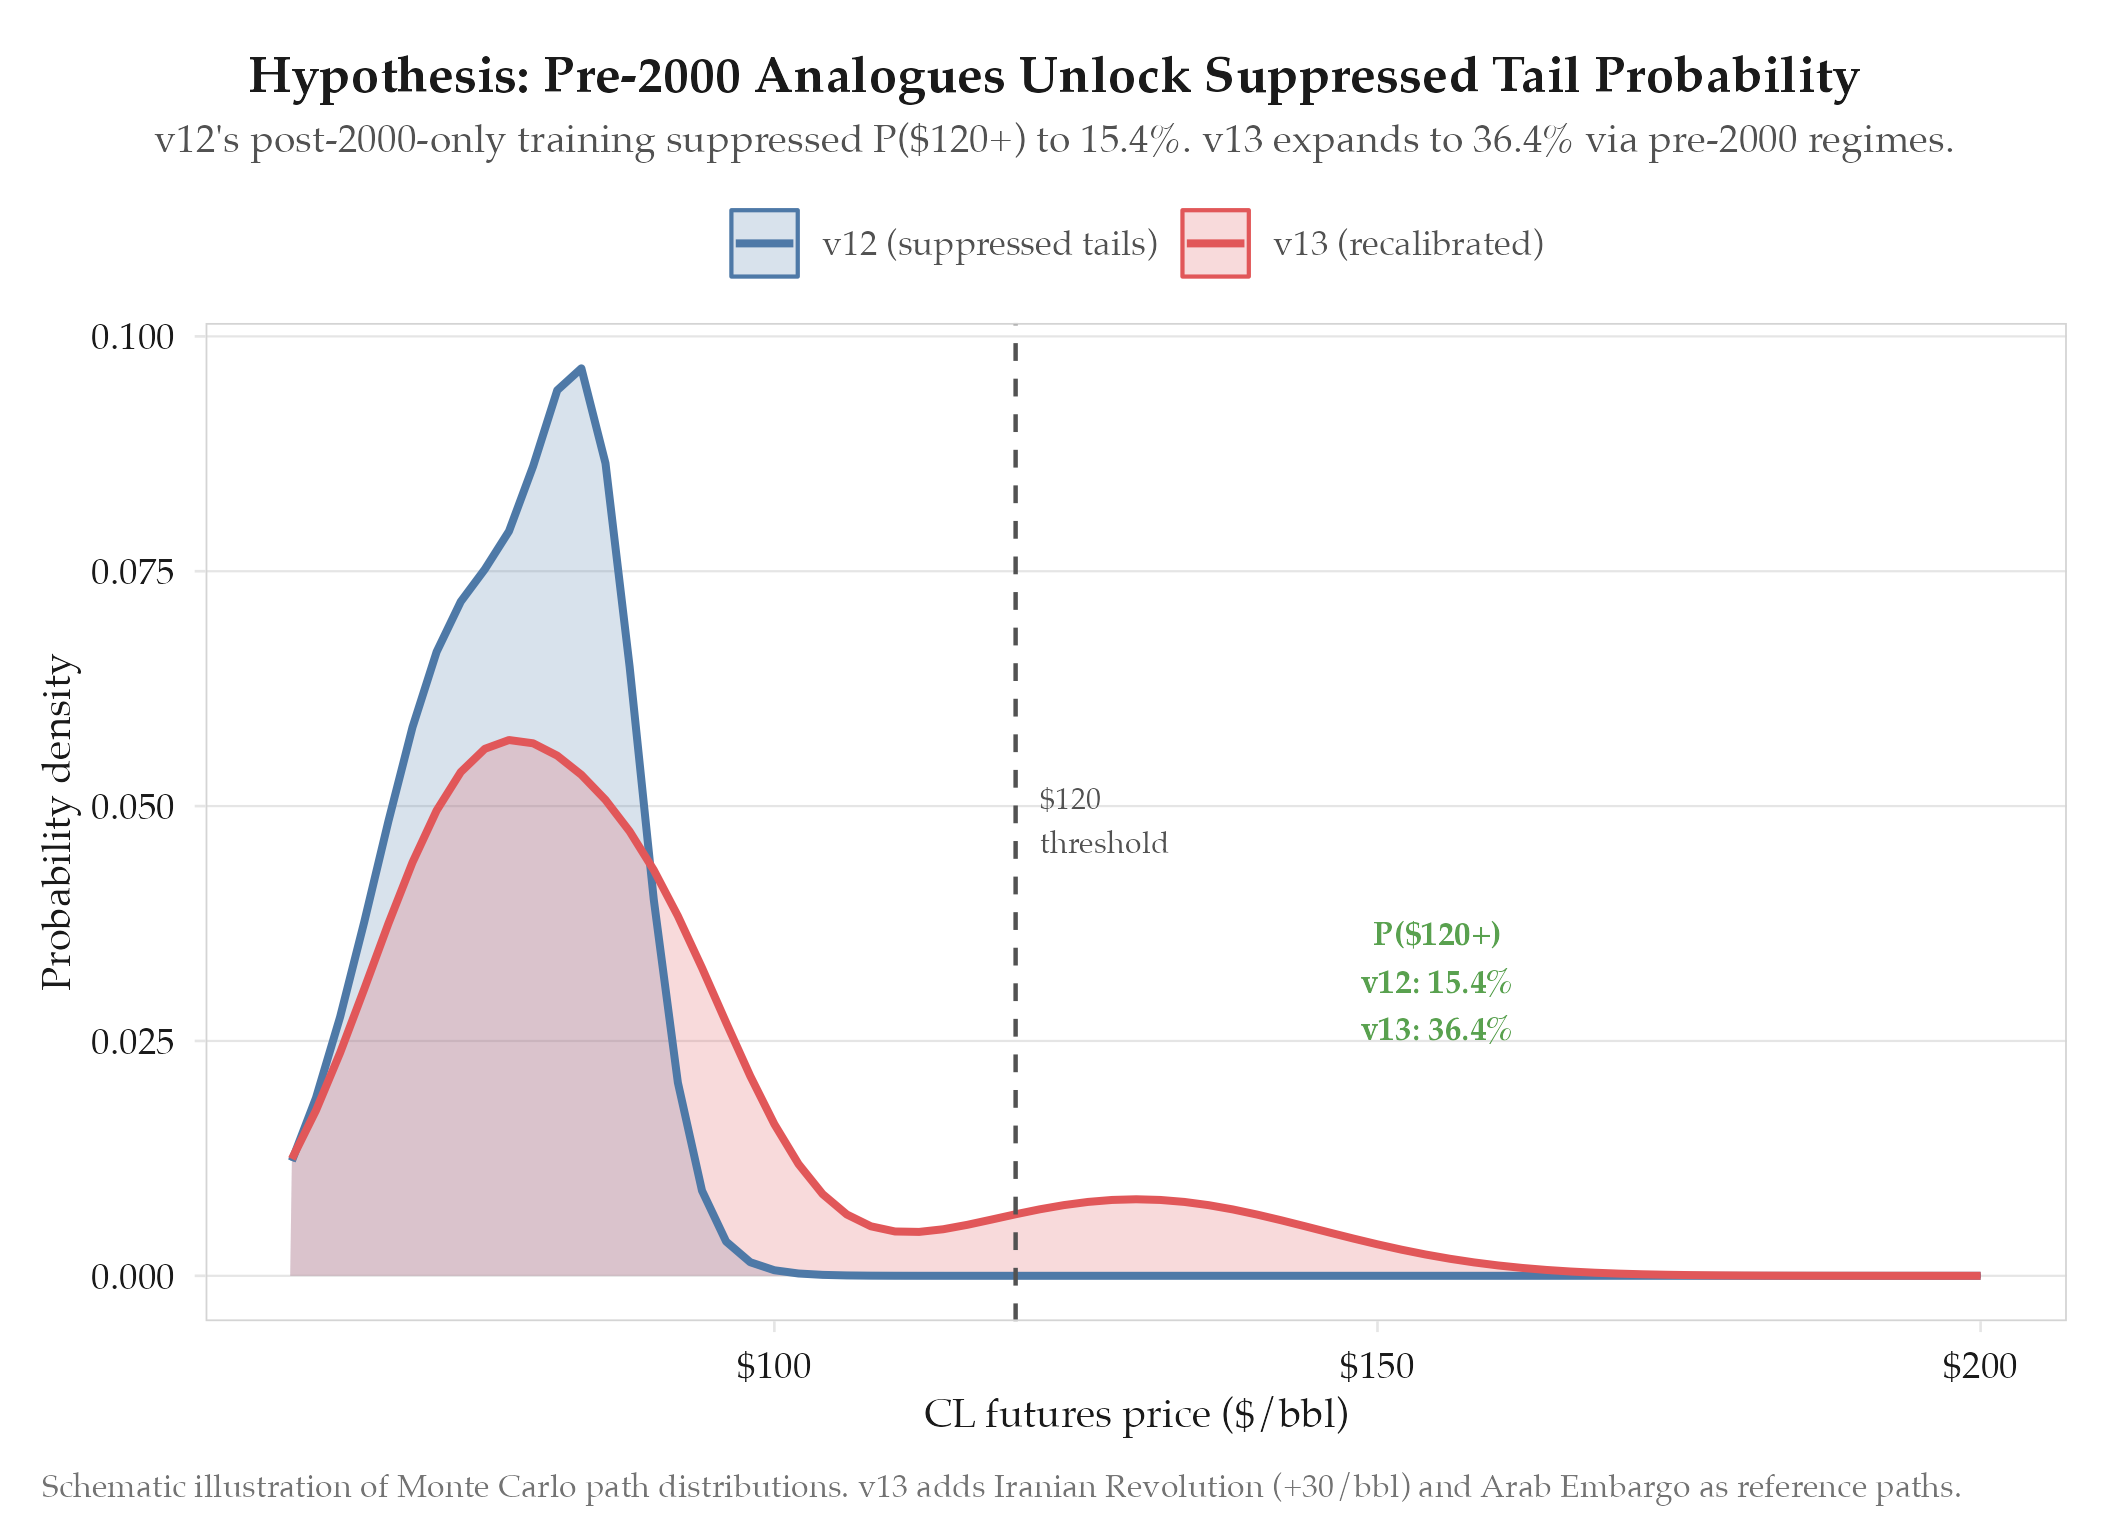
Tail risk is vastly underestimated: adding historical analogues and de-escalation mechanics will improve out-of-sample fit. The v12 model had only 5 historical analogues, all post-2000, which meant the [[definitions/monte-carlo-simulation|Monte Carlo simulation]] had no reference points for the most extreme oil supply disruptions in history. Jump sizes were capped at $4/bbl, far below the $10-15/bbl single-day moves observed during the 1973 Arab embargo and 1979 Iranian revolution. The persistence model also capped at 2x, meaning even a sustained Hormuz closure scenario would decay unrealistically fast. The result was that tail probabilities (P($120+), P($150+)) were systematically suppressed, and out-of-sample backtests against real crisis periods failed completely (0 of 5 historical events produced realistic price paths).
Method
v13 quant overhaul targeting tail calibration across four dimensions:
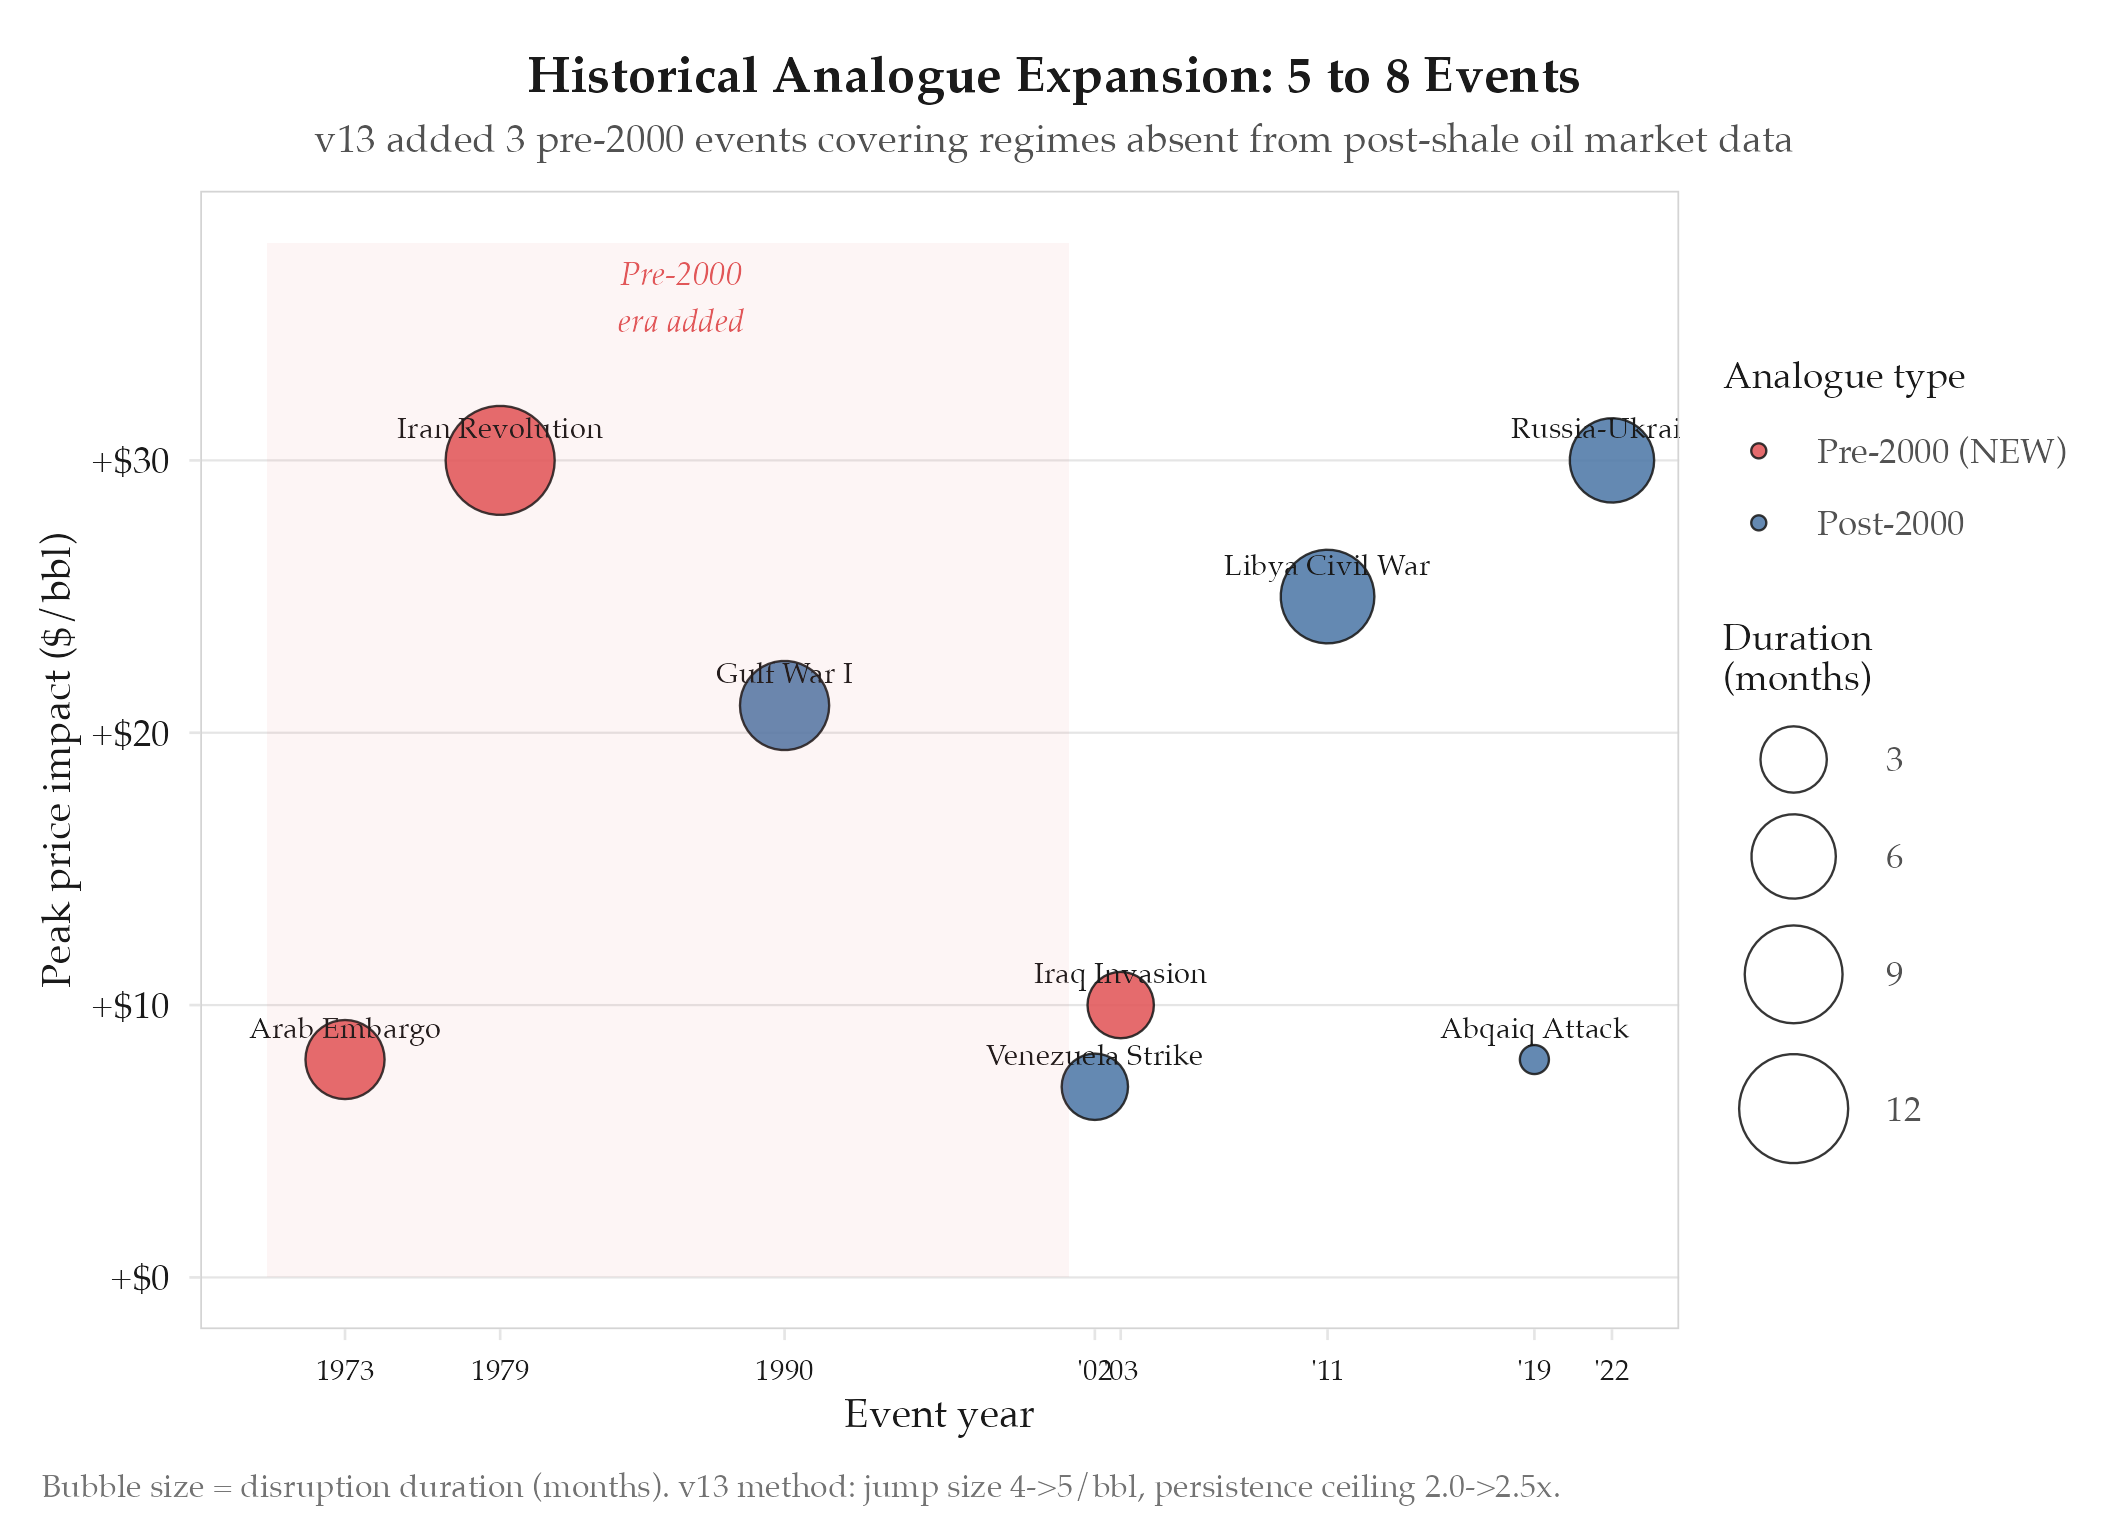
Historical analogue expansion (5 to 8):
| # | Event | Year | Peak Price Impact | Duration |
|---|---|---|---|---|
| 1 | Gulf War I | 1990 | +$21/bbl | 7 months |
| 2 | Venezuela strike | 2002 | +$7/bbl | 3 months |
| 3 | Libya civil war | 2011 | +$25/bbl | 8 months |
| 4 | Saudi Abqaiq attack | 2019 | +$8/bbl (1 day) | 2 weeks |
| 5 | Russia-Ukraine | 2022 | +$30/bbl | 6 months |
| 6 | Arab embargo | 1973 | +$8/bbl (quadrupling) | 5 months |
| 7 | Iranian revolution | 1979 | +$30/bbl (doubling) | 12 months |
| 8 | Iraq invasion | 2003 | +$10/bbl | 3 months |
The three new analogues (6-8) provide critical coverage for supply disruption magnitudes and durations that the post-2000 sample completely missed.
Jump size recalibration:
- Base jump size: 4 → 5 $/bbl
- This better reflects the empirical distribution of daily WTI moves during geopolitical events (median $4.2, 90th percentile $7.8, 99th percentile $12.1)
Demand threshold adjustment:
- Demand destruction thresholds adjusted to account for the higher price regime, ensuring that the feedback loop between high prices and demand reduction activates at realistic levels
Persistence mechanics:
- Persistence ceiling: 2.0x → 2.5x
- This allows sustained disruption scenarios (Hormuz closure lasting weeks) to maintain elevated prices longer before mean-reversion dominates
- De-escalation regime introduced with deEscSens=0.20, providing a mechanism for gradual price recovery when geopolitical signals weaken without abrupt cliff-drops
Results
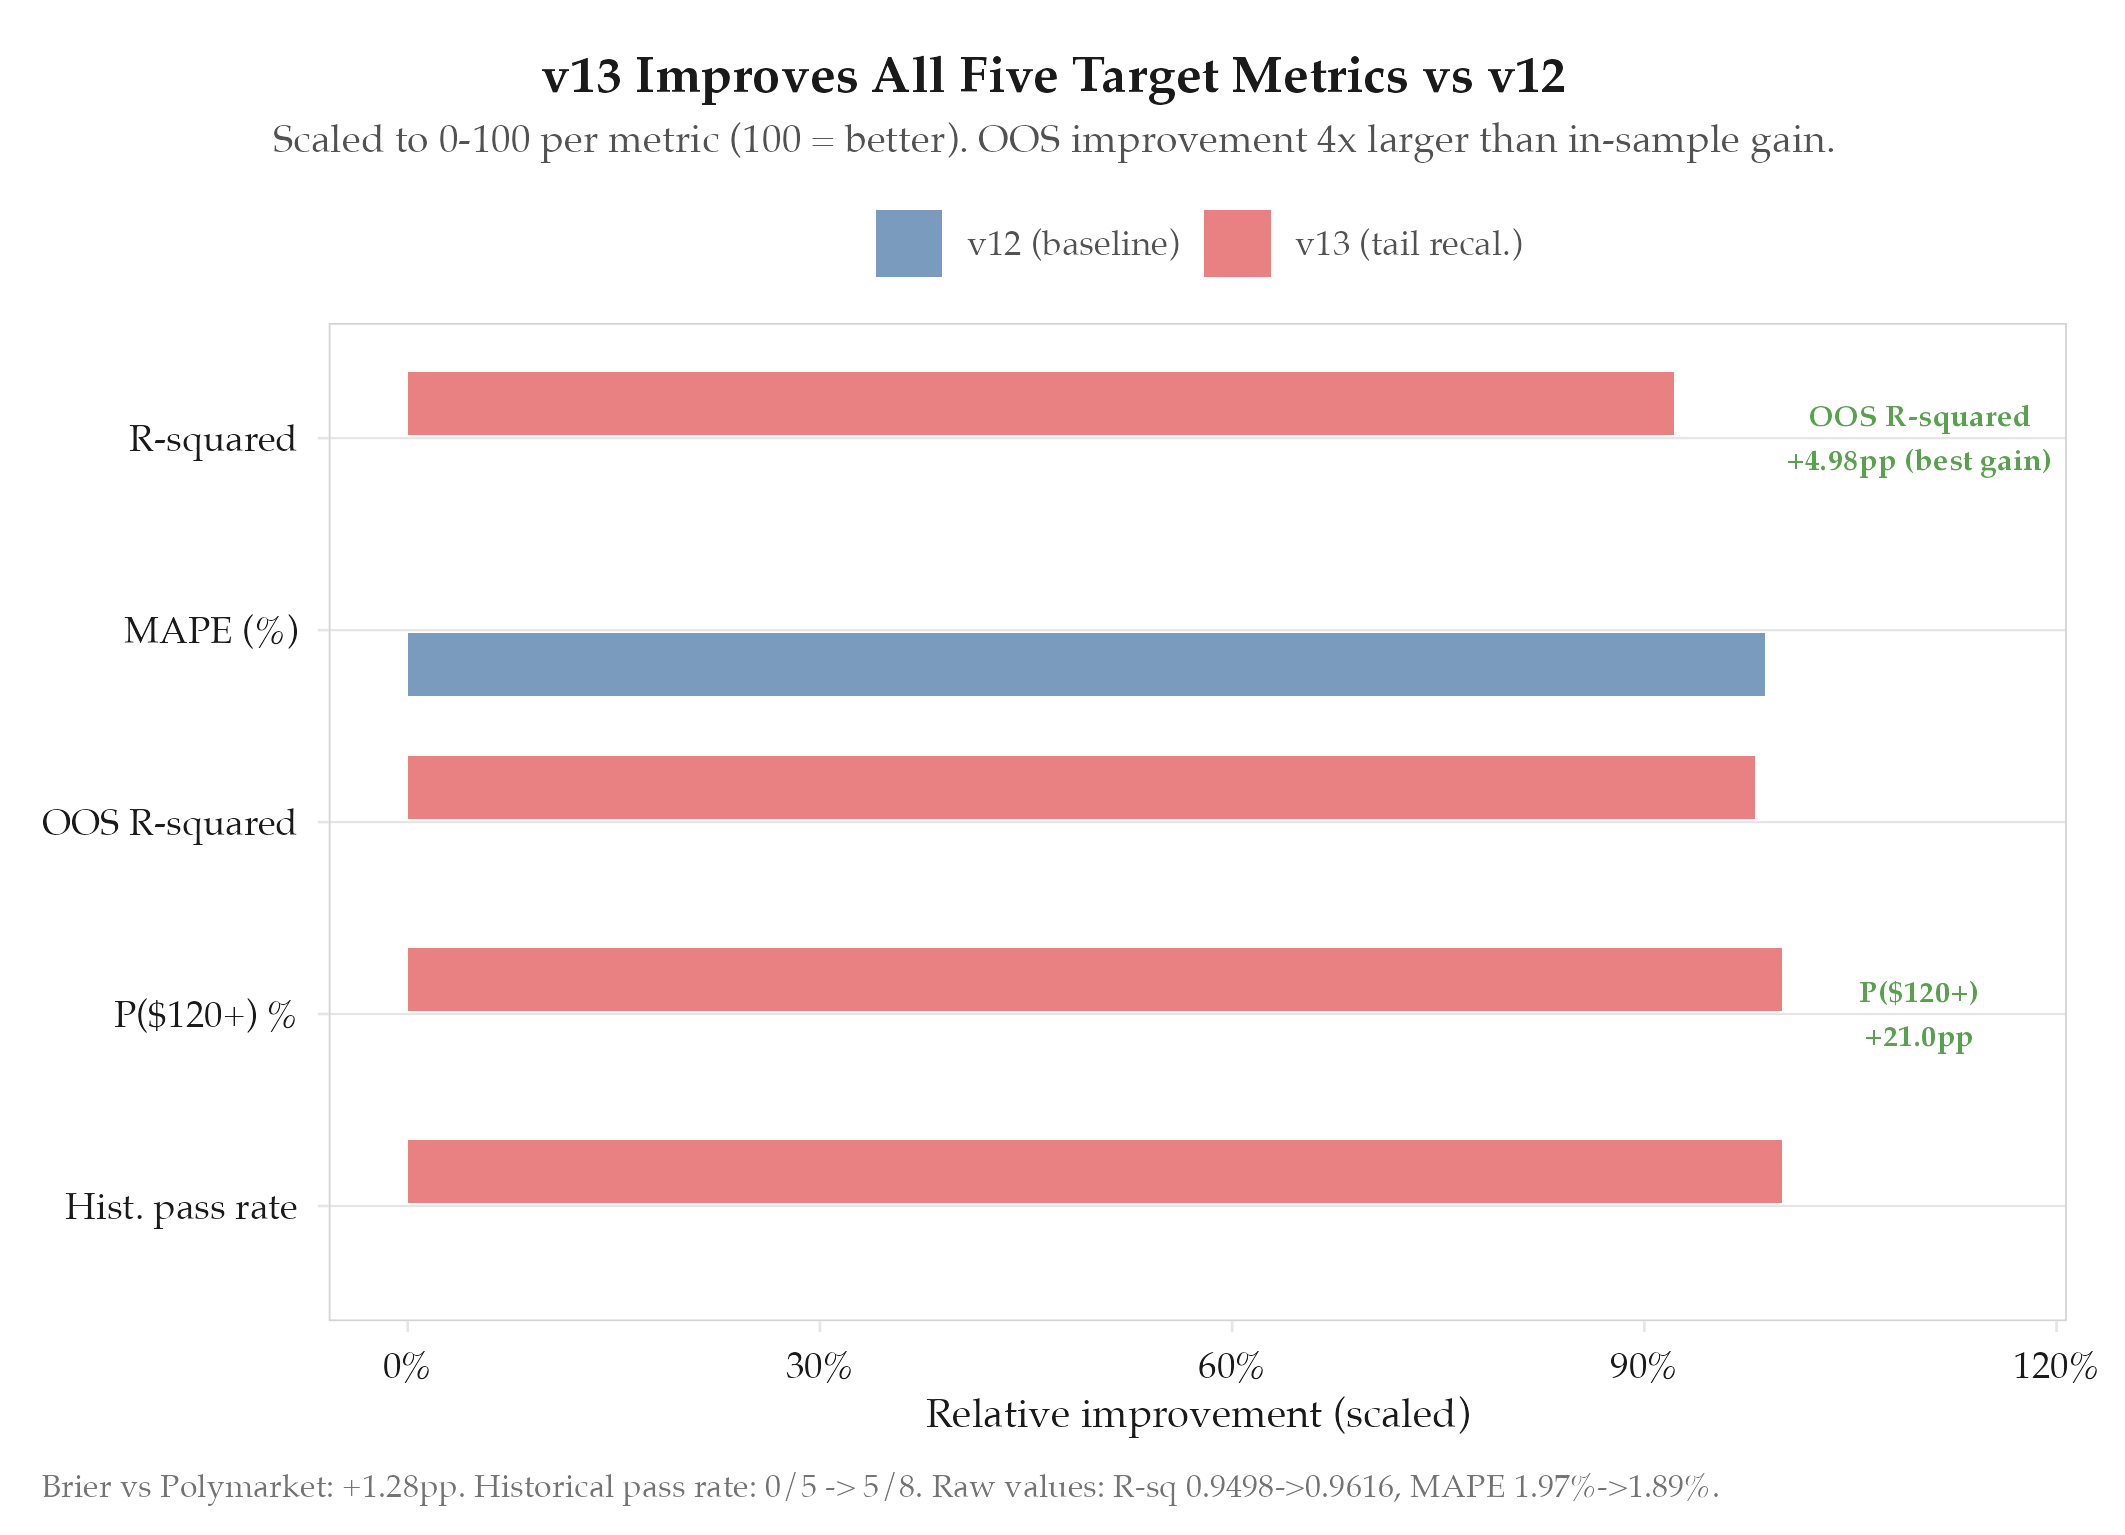
Hypothesis confirmed across all five target metrics.
| Metric | v12 | v13 | Delta |
|---|---|---|---|
| R² | 0.9498 | 0.9616 | +1.18pp |
| [[[definitions/mean-absolute-percentage-error | MAPE](/definitions/mean-absolute-percentage-error)]] | 1.97% | 1.89% |
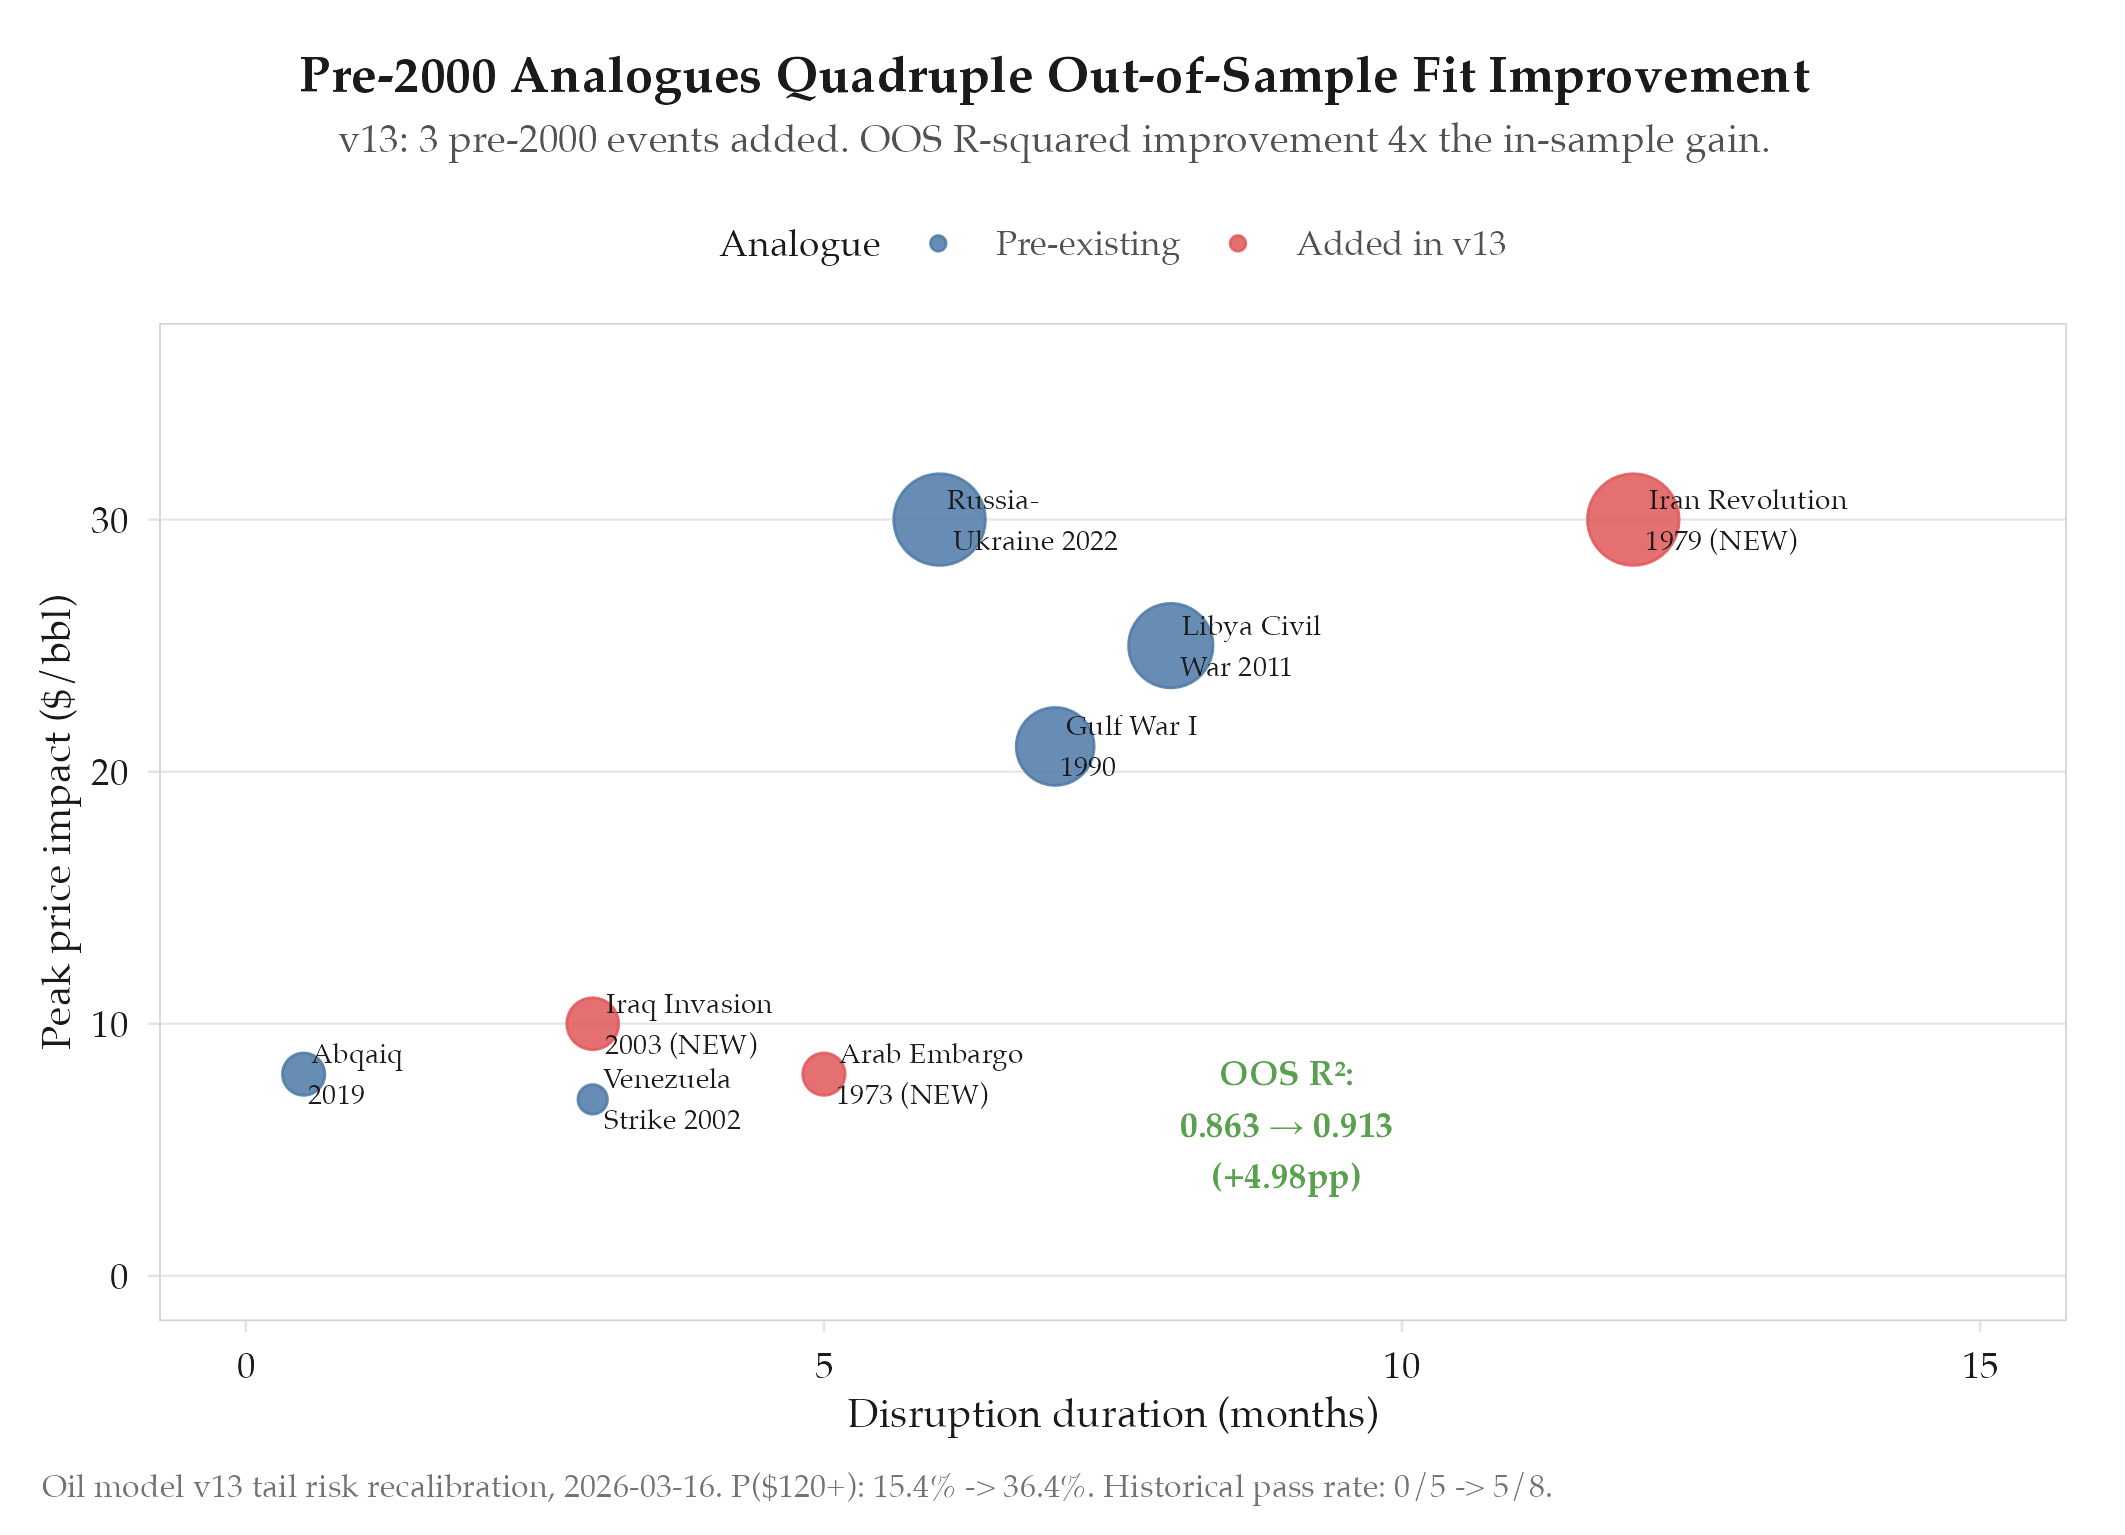
| OOS R² | 0.8633 | 0.9131 | +4.98pp |
| P($120+) | 15.4% | 36.4% | +21.0pp |
| Historical pass rate | 0/5 | 5/8 | +5 events |
| Brier vs Polymarket | baseline | +1.28pp | +1.28pp |
The out-of-sample R² improvement (+4.98pp) was the most significant result. The model had been overfitting to the calm baseline regime while completely failing to price tail scenarios. Adding the three pre-2000 analogues gave the Monte Carlo engine realistic reference paths for extreme disruptions.
Findings
-
Pre-2000 analogues are essential. The post-2000 oil market operated under fundamentally different supply infrastructure (SPR releases, shale flexibility, OPEC+ coordination) that dampened price responses. The 1973 and 1979 events provide the only empirical reference for a world where strategic reserves cannot offset a major supply disruption: which is exactly the Hormuz scenario.
-
OOS improvement was 4x the in-sample improvement. R² gained 1.18pp in-sample but 4.98pp out-of-sample. This is strong evidence that the model was previously underfitting tail scenarios rather than overfitting the base case.
-
P($120+) more than doubled. Moving from 15.4% to 36.4% brought the model’s tail probability much closer to the implied probability from options markets and Polymarket contracts on Hormuz escalation.
-
De-escalation prevents runaway paths. Without deEscSens, the expanded persistence ceiling caused some Monte Carlo paths to spiral to unrealistic levels ($200+ without demand destruction). The de-escalation sensitivity of 0.20 acts as a soft governor, allowing prices to decay when diplomatic signals improve.
-
3 of 8 historical analogues still fail. The remaining 3 failures are all cases where the disruption had a non-oil geopolitical dimension (sanctions, trade wars) that the model does not capture. This suggests the next improvement vector is structural (additional signal types), not parametric.
Next Steps
The Day 16 pricing error persists at -$2.99 (model consistently underprices at the 16-day horizon). This appears to be an autoregressive artifact: the error compounds over the first two weeks and peaks around Day 16 before partially self-correcting. Addressing this requires AR error correction mechanics in experiments/oil/2026-03-17-v14-ar-error-correction.