Sharpe Ratio
Return per unit of risk. Measures whether you're getting paid enough for the danger you're taking.
Return per unit of risk. Measures whether you're getting paid enough for the danger you're taking.
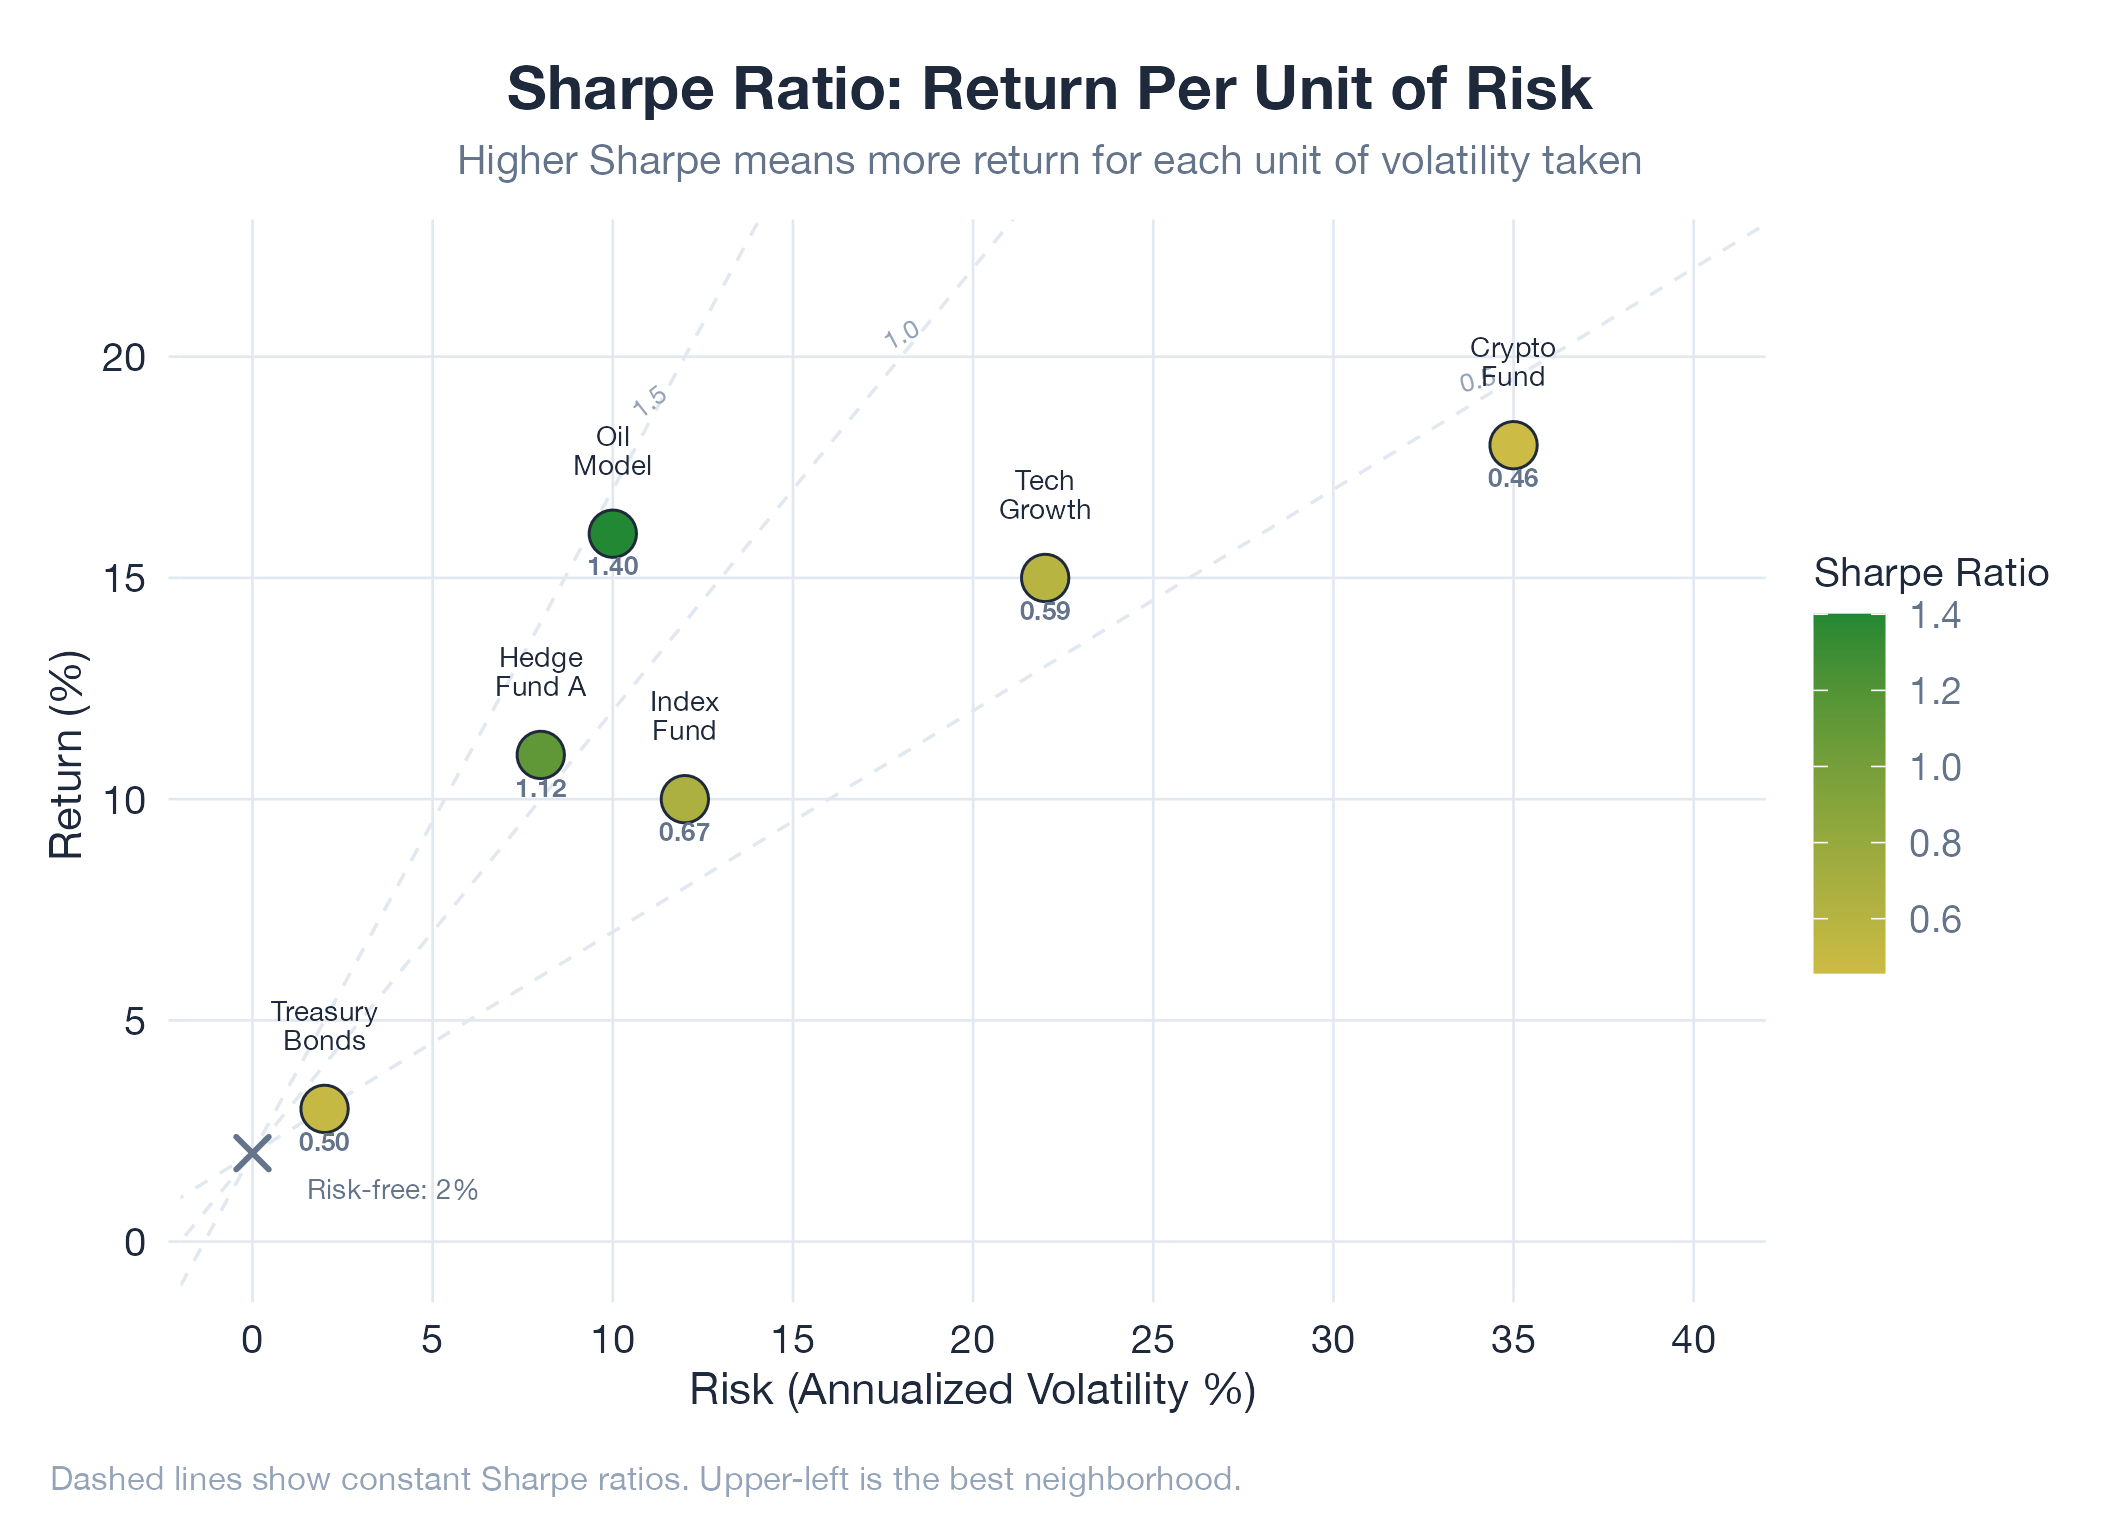
The Sharpe ratio answers the question every investor should ask: am I being compensated for the risk I’m taking, or am I just getting lucky on a roller coaster? Two funds both returning 20% look identical until you look at volatility: the one that achieved it with steady growth has a far higher Sharpe than the one that swung wildly. Formula: (Portfolio Return − Risk-Free Rate) / Portfolio Volatility. Benchmarks: below 0.5 is poor, 1.0–2.0 is good, above 3.0 is exceptional (verify your data).
How It Works
Numerator = excess return above the risk-free rate (T-bills, ~4–5% in 2026). Denominator = standard deviation of returns. Higher Sharpe = more return per unit of risk taken.
Example
During v16 sell model tuning, multiple strategy variants produced similar total returns. The Sharpe ratio differentiated them sharply: wide-stop variant scored 1.8 (smooth equity curve), tight-stop variant scored 0.6 (same total return, jagged path). The model selected the high-Sharpe variant. Detailed in Oil v16 Sell Model.