Drawdown
The fall from peak to trough. How much you lost before recovering, and how long it took.
The fall from peak to trough. How much you lost before recovering, and how long it took.
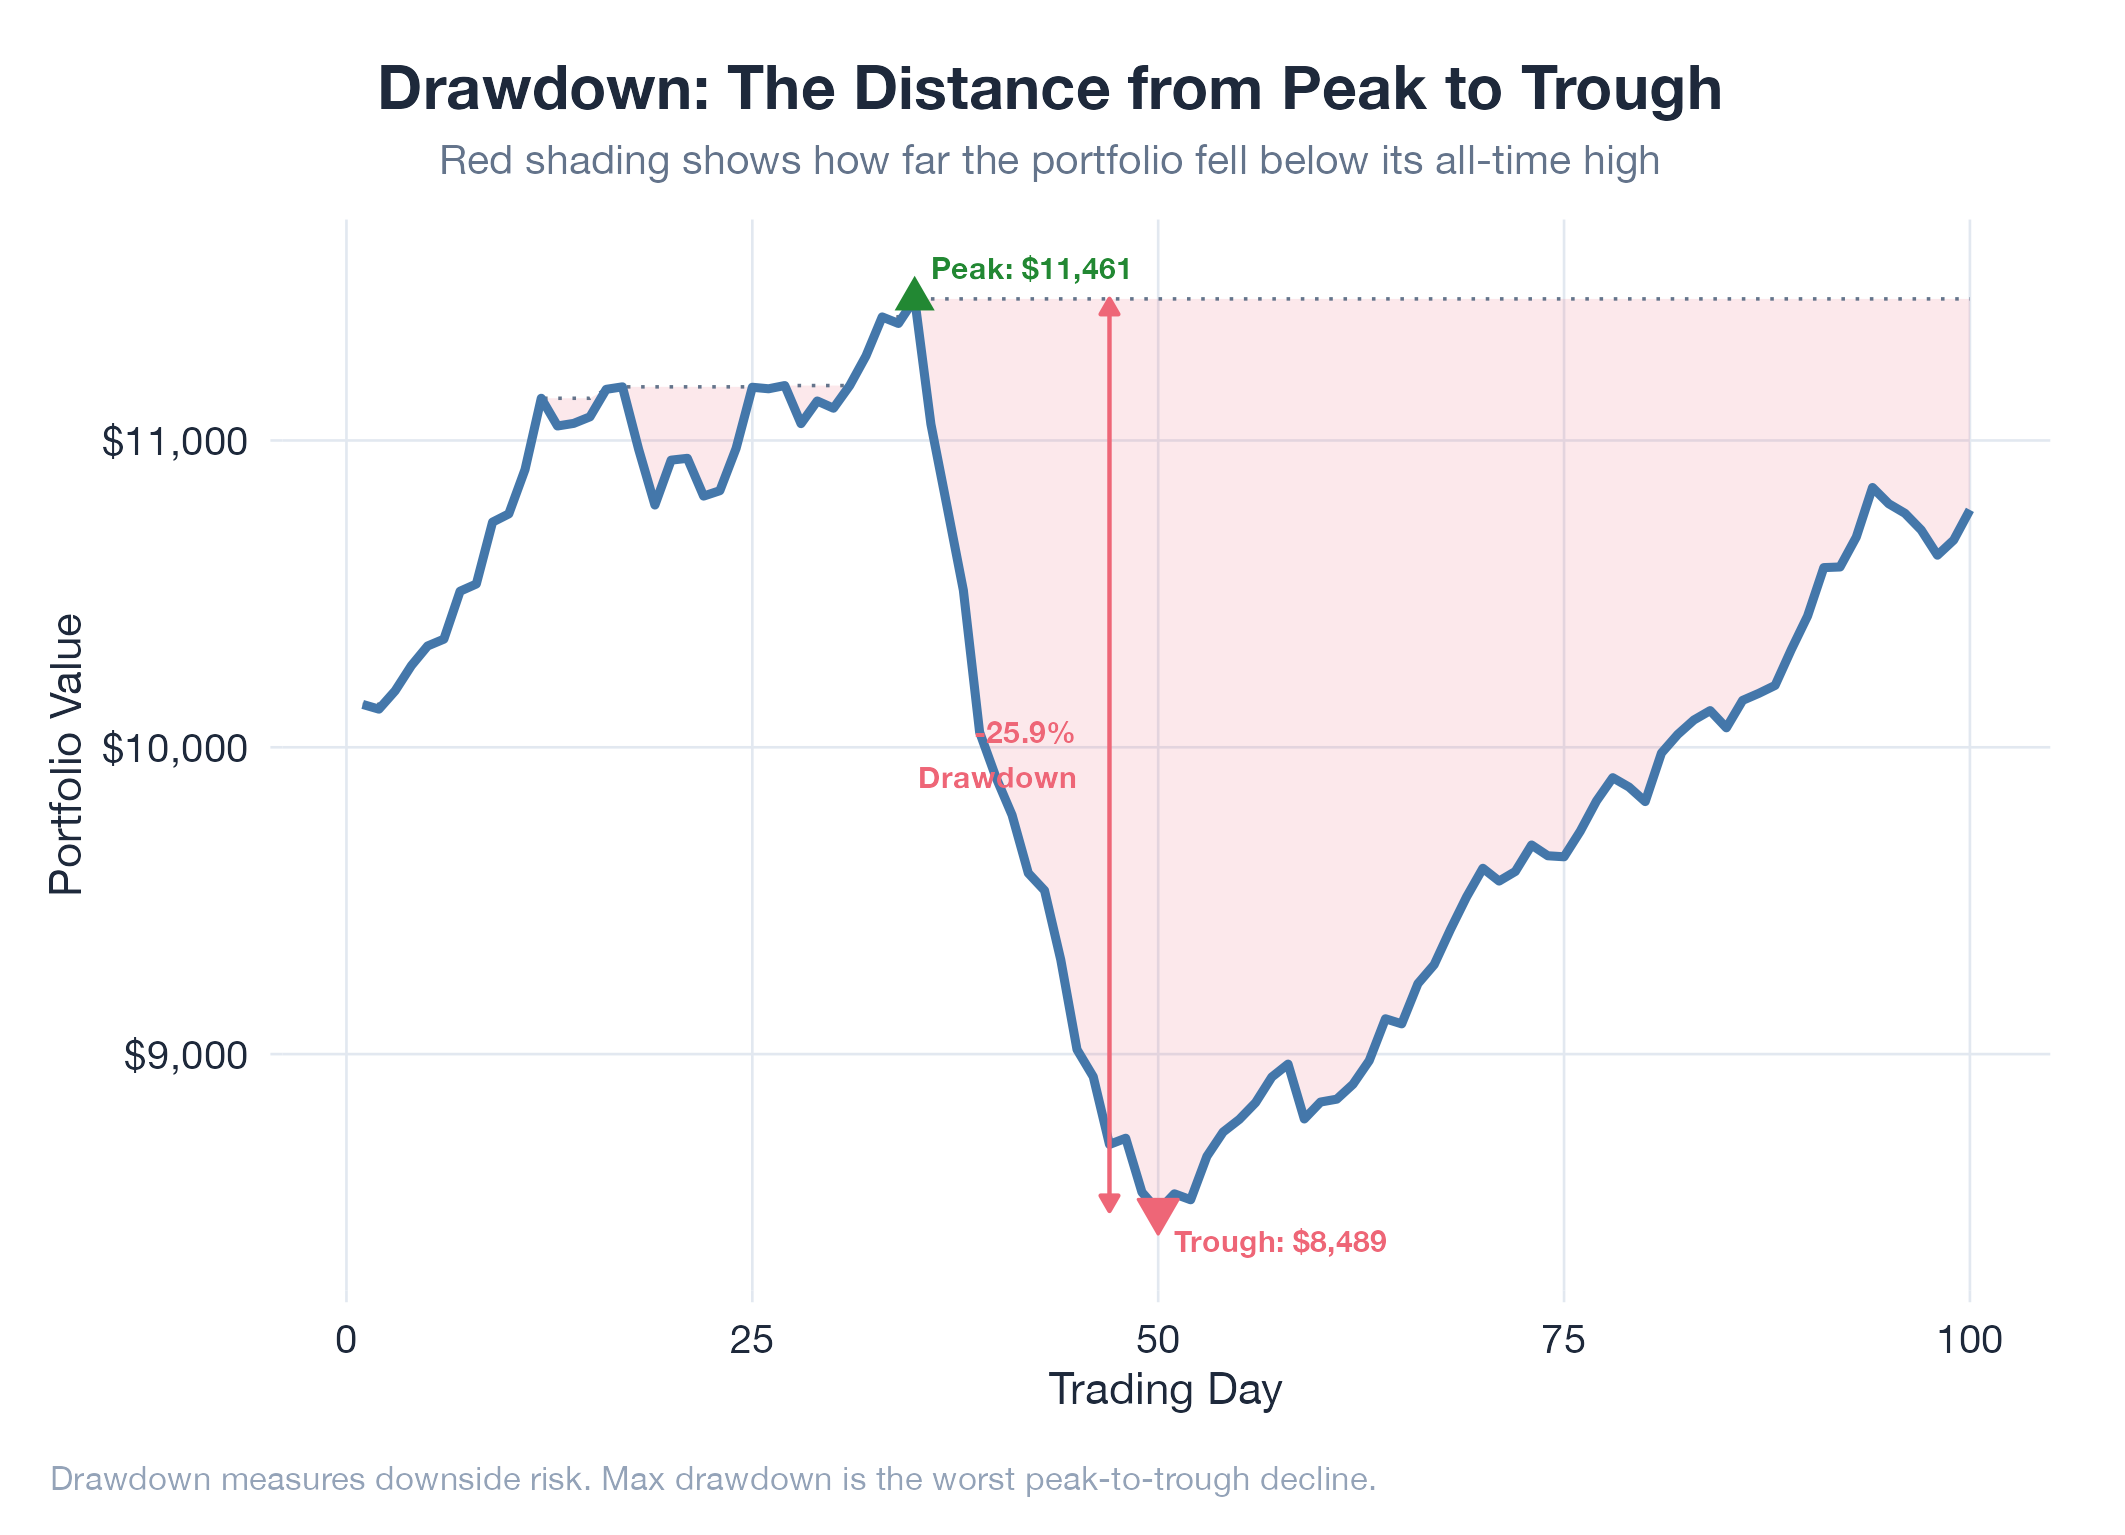
Drawdown measures the decline from a portfolio’s peak to the lowest point before a new peak is reached: answering two questions total return hides: how much did you lose at the worst point, and how long did the pain last? A 25% drawdown requires a 33% gain just to recover. A 50% drawdown requires 100%. This asymmetry is why drawdown control matters more than return maximization: the deeper the hole, the exponentially harder it is to climb out. Maximum drawdown (MDD) is the single worst peak-to-trough decline in history: the worst experience an investor endured.
How It Works
Track running peak value → compute current value / peak − 1 → MDD = minimum of all these values. Recovery time = bars from trough until a new all-time high.
Example
During v13 tail risk recalibration, Monte Carlo simulations revealed the unconstrained strategy had expected MDD of 18% during Hormuz escalation scenarios. Position sizing was adjusted to cap MDD at 12% under the 95th-percentile worst case. Detailed in Oil v13 Tail Risk Recalibration.