CVaR (Conditional Value at Risk)
The average loss in the worst-case scenarios. Measures how bad things get when they get bad.
The average loss in the worst-case scenarios. Measures how bad things get when they get bad.
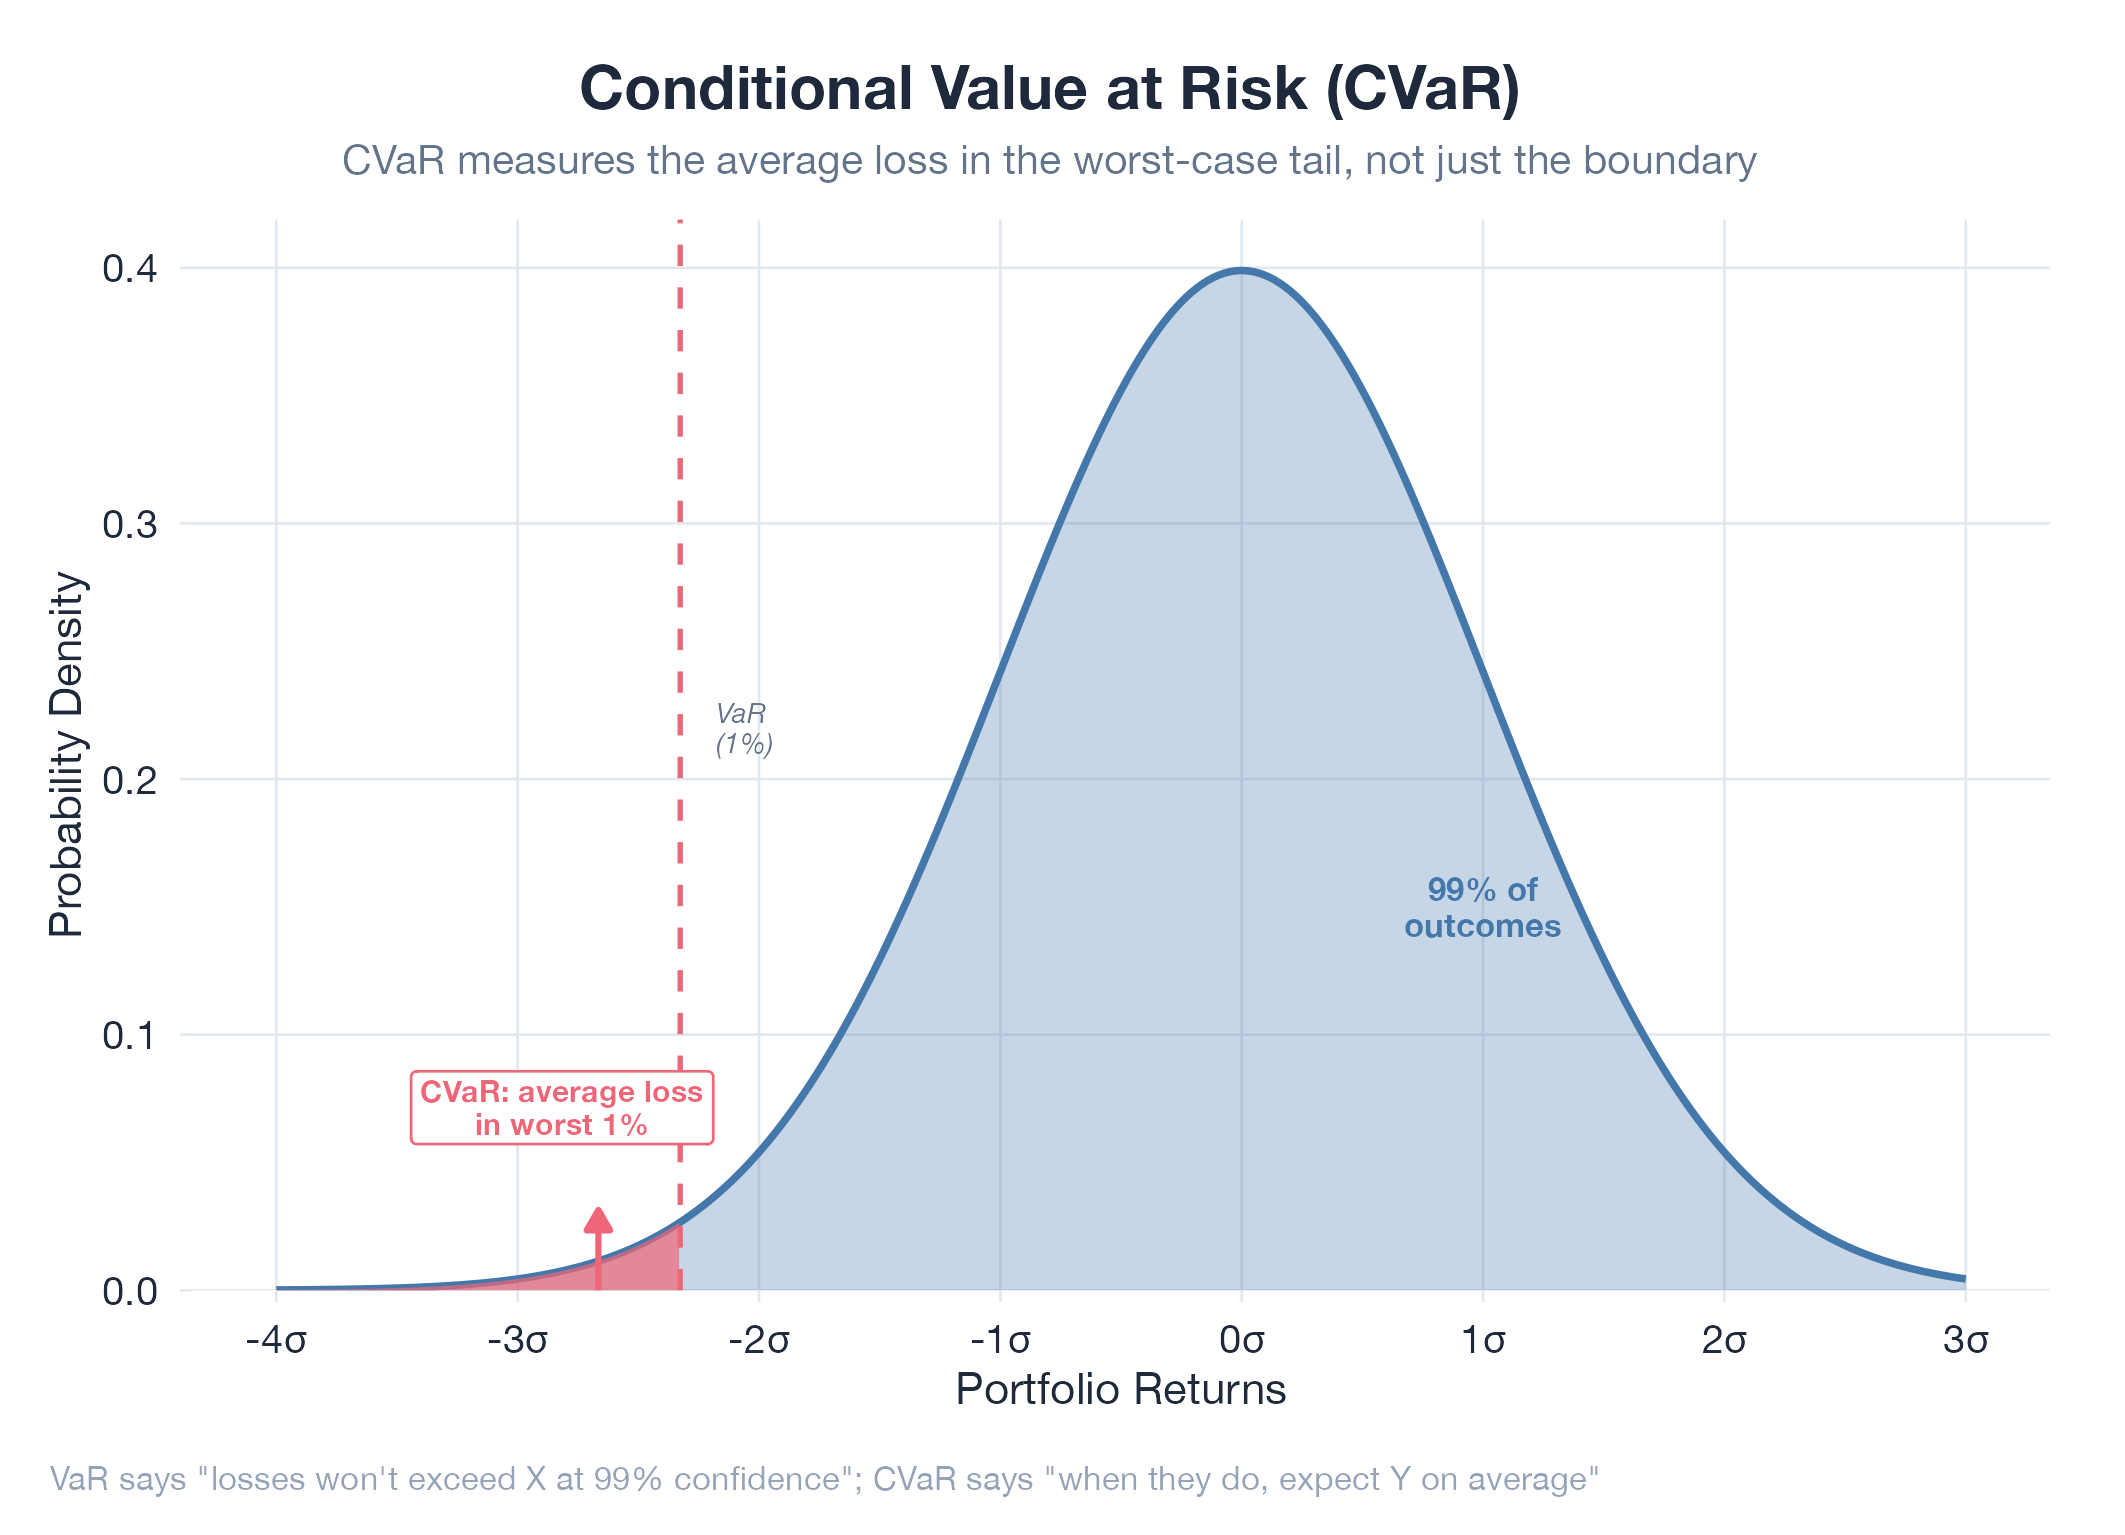
CVaR (also called Expected Shortfall) focuses on the tail of your loss distribution: the worst X% of outcomes. Pick a 95% confidence level: that means you’re looking at the worst 5% of scenarios: then average the losses across only those worst-case scenarios. Compare this to VaR (Value at Risk), which just tells you where the cliff edge is (“5% chance losses exceed $3.50/barrel”). CVaR tells you how far you fall: “in that worst 5%, you lose $5.20/barrel on average.” CVaR is always worse than VaR, and that’s exactly the point.
How It Works
CVaR at confidence level α = average loss across the (1−α) worst scenarios. For oil: run Monte Carlo with thousands of price paths, sort by loss, take the bottom 5%, average them.
Example
During v13 tail risk recalibration, Monte Carlo simulations revealed that the worst 5% of Hormuz escalation scenarios could move oil $8–12 in a single session. CVaR quantified this, informing defensive position sizing. Full details in Oil v13 Tail Risk Recalibration.