MAPE (Mean Absolute Percentage Error)
MAE as a percentage. Makes errors comparable even when the numbers are wildly different scales.
MAE as a percentage. Makes errors comparable even when the numbers are wildly different scales.
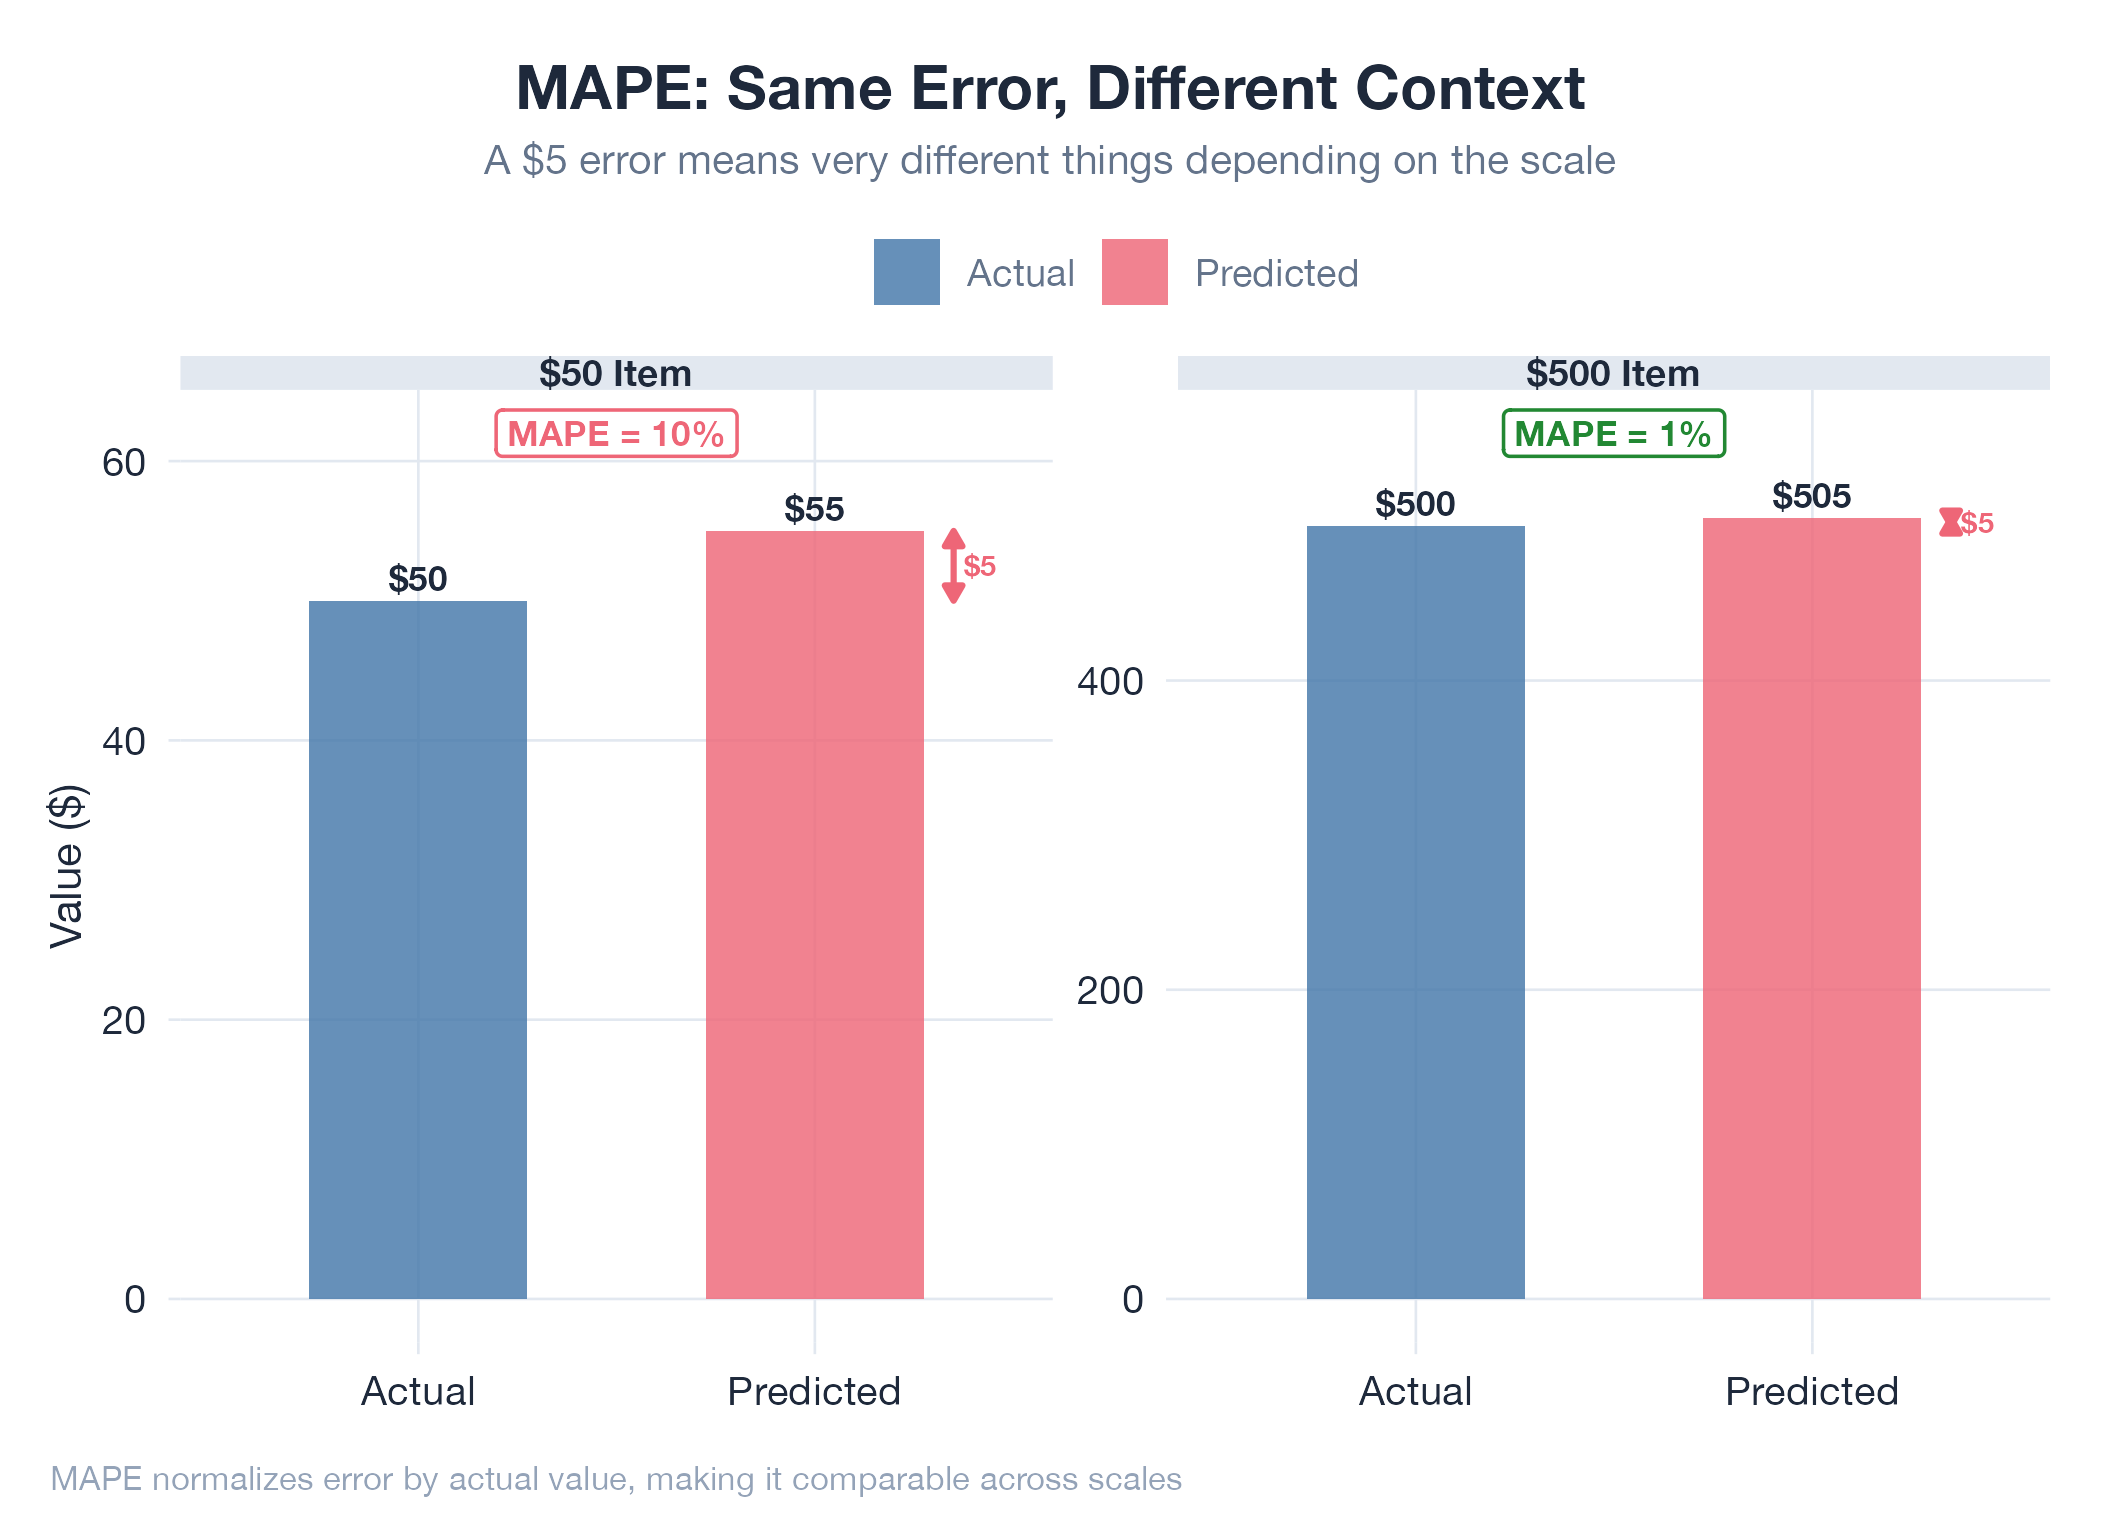
MAPE takes MAE and expresses it as a percentage of the actual value, so you can compare accuracy across completely different scales. Being off by $15,000 on a $500,000 house is a 3% error; being off by $0.30 on a $4.00 coffee is 7.5%. MAPE tells you which forecaster is actually better. Rules of thumb: under 10% is highly accurate, 10–20% is good, over 50% is poor. One caveat: MAPE breaks down when actual values are near zero (dividing by a tiny number inflates the percentage).
How It Works
MAPE = mean(|predicted − actual| / actual) × 100%. Unlike MAE, the result has no units: it’s always a percentage, which makes it the universal language of forecast accuracy.
Example
The oil model achieved MAPE of 2.26% on WTI crude futures. With oil at $70–80/barrel, that means predictions typically land within $1.60–1.80 of actual price. This held up across 34 days of forward testing, including a sanctions waiver that moved prices by several dollars in a single session. Measured in Oil v16.