Statistical Significance
Is your result real or just luck? The math that tells you whether to trust your experiment.
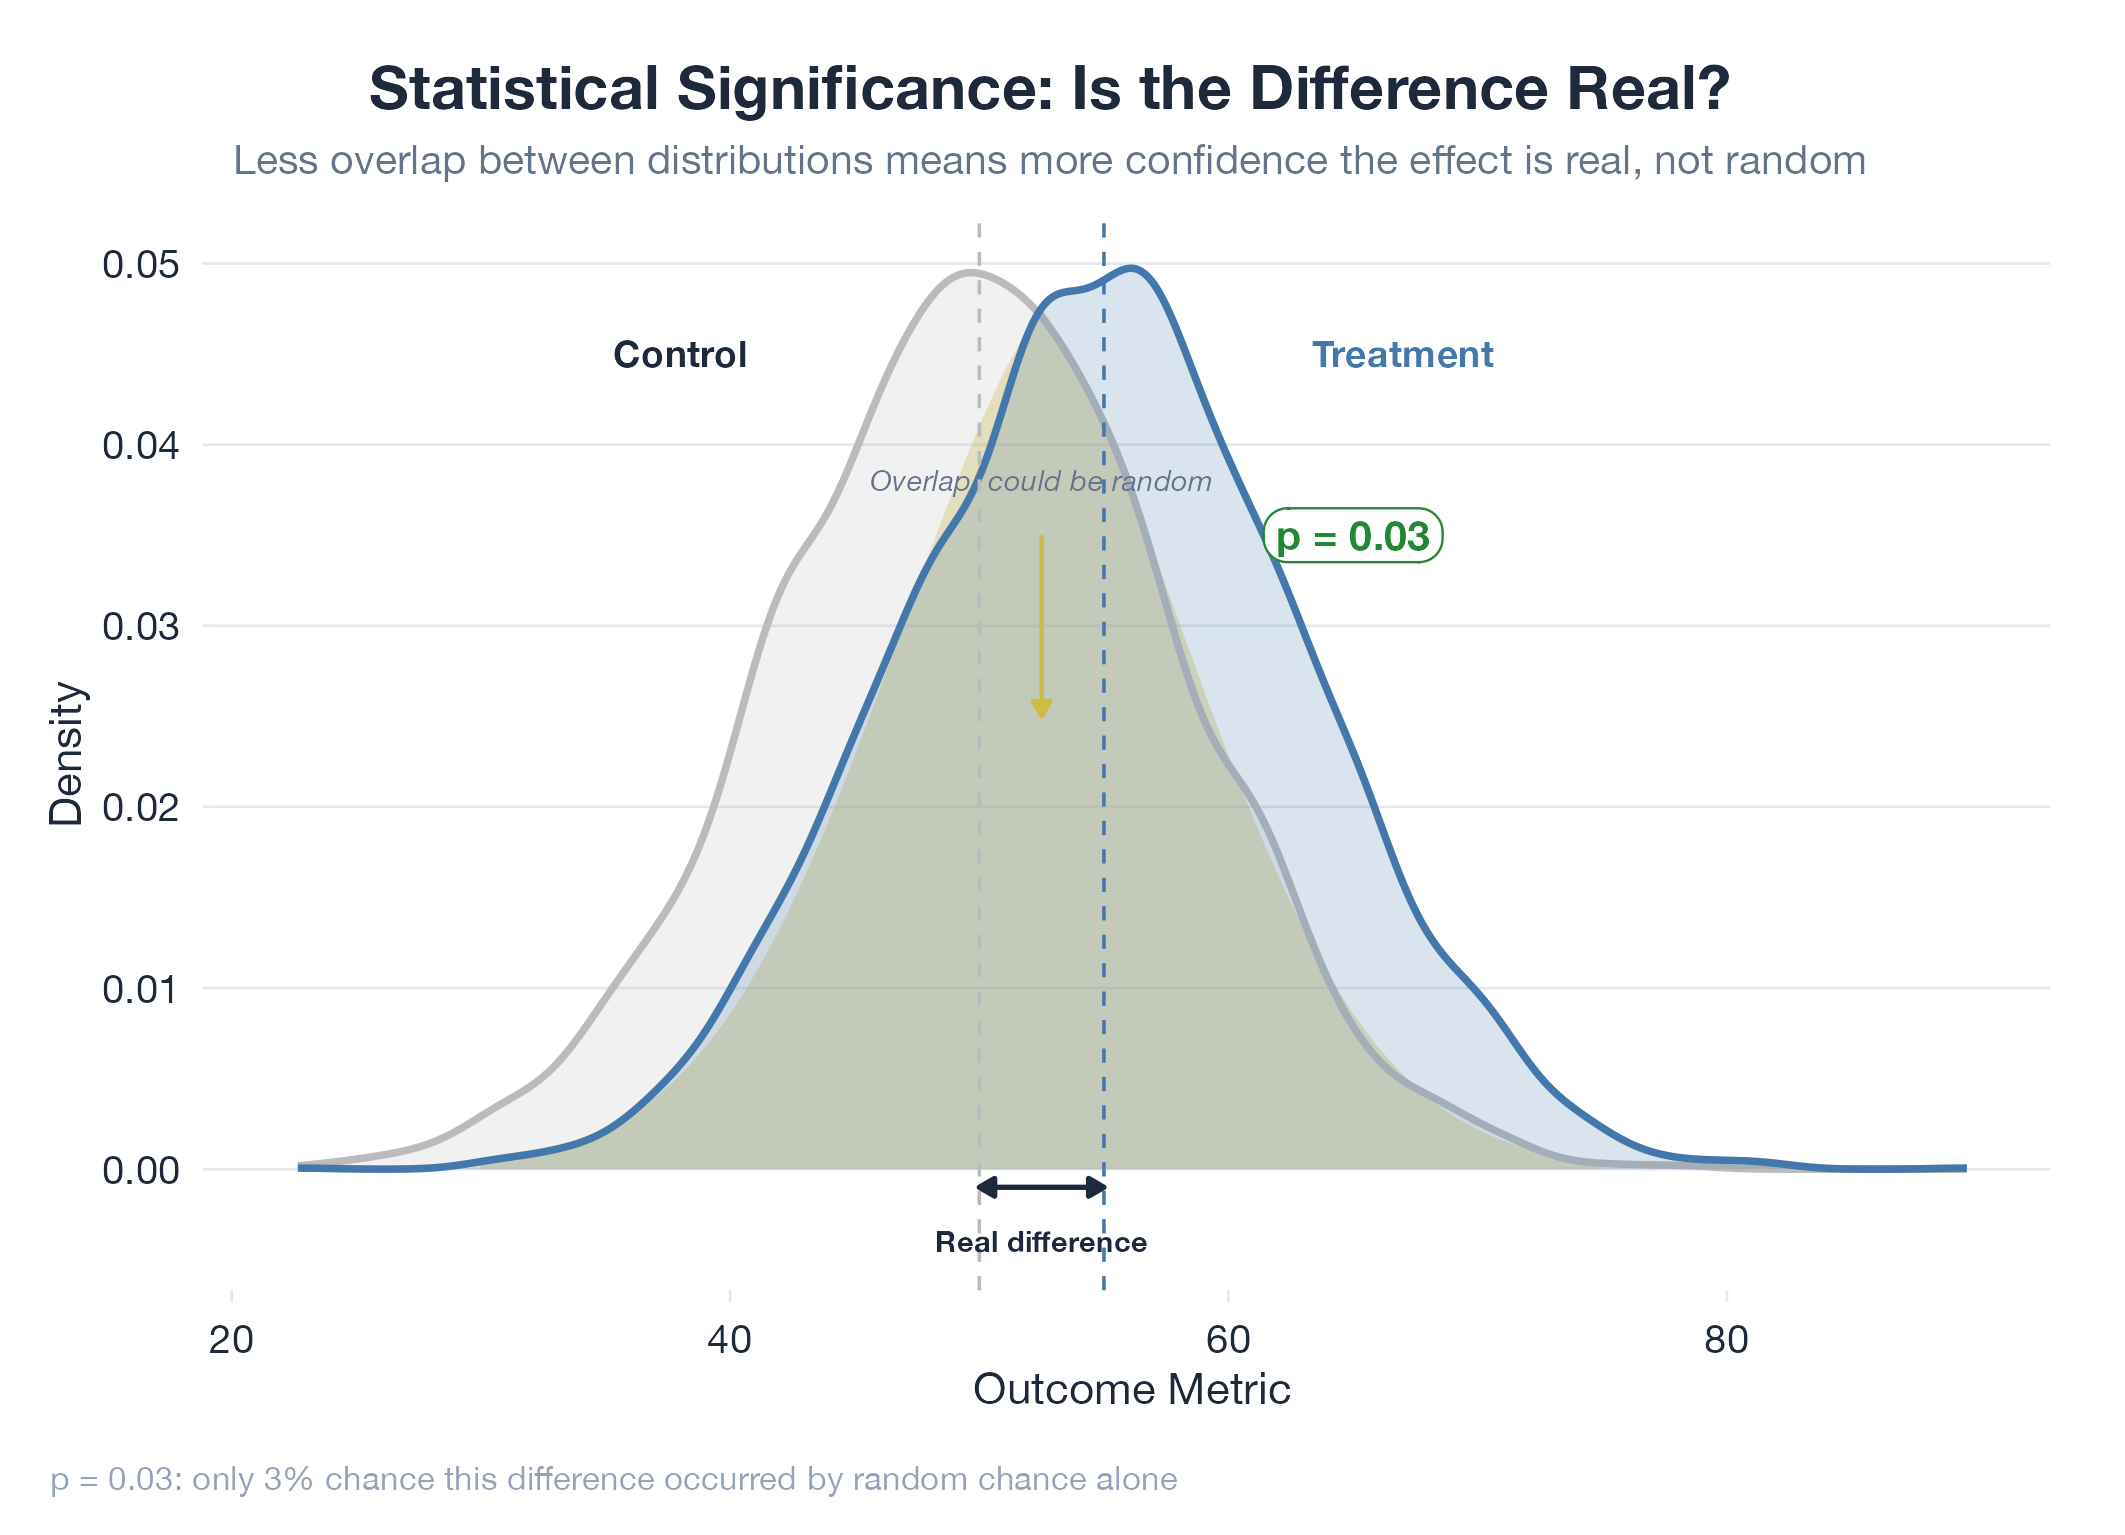
Statistical significance is the line between “this result is probably real” and “this result could easily be noise.” You flip a coin 10 times and get 7 heads : rigged, or lucky? The math computes a p-value: the probability of seeing a result this extreme if nothing actually changed. If p < 0.05, you declare the result significant. Critical caveat: a p-value of 0.03 does not mean “3% chance the result is fake.” It means “if nothing changed, there’s a 3% chance you’d see data this extreme.” Common traps: testing multiple metrics and only reporting the significant one, stopping early when results look good, and confusing “not significant” with “definitely no effect.”
How It Works
Assume H0 (nothing changed) → compute test statistic from your data → find p-value (probability of this statistic under H0) → if p < threshold (typically 0.05), reject H0. Statistical significance ≠ practical significance.
Example
The oil model’s +2.16pp Brier edge over Polymarket over 34 days raises the question: is that real alpha, or a lucky streak? The lab addresses this with Monte Carlo bootstrap resampling to estimate the probability that the observed edge is genuine. For the oil model, 34 consecutive forward-testing days with a monotonically improving ratchet produce a stronger signal : the ratchet structure ensures no cherry-picking. Discussed in Oil v17.