DQI (Data Quality Index)
Composite score measuring how complete and correct your data is. Seven components, one number.
Composite score measuring how complete and correct your data is. Seven components, one number.
DQI is a weighted composite of seven data-health dimensions: completeness, freshness, accuracy, consistency, temporal spread, geographic relevance, and description quality: combined into a single 0–1 score. Think of it like a restaurant health inspection: one inspector checks the kitchen, storage, handwashing, temperatures, and expiration dates. Each area scores independently, and together they tell you whether the operation is safe. Scores above 0.95 are production-ready; below 0.85 needs systematic remediation.
How It Works
Each dimension scores 0–1, weighted by business importance. Final DQI = weighted average. The weights are configurable: the internal audit pipeline exposes five FIELD_ENFORCEMENT params so domain priorities can shift without code changes.
Example
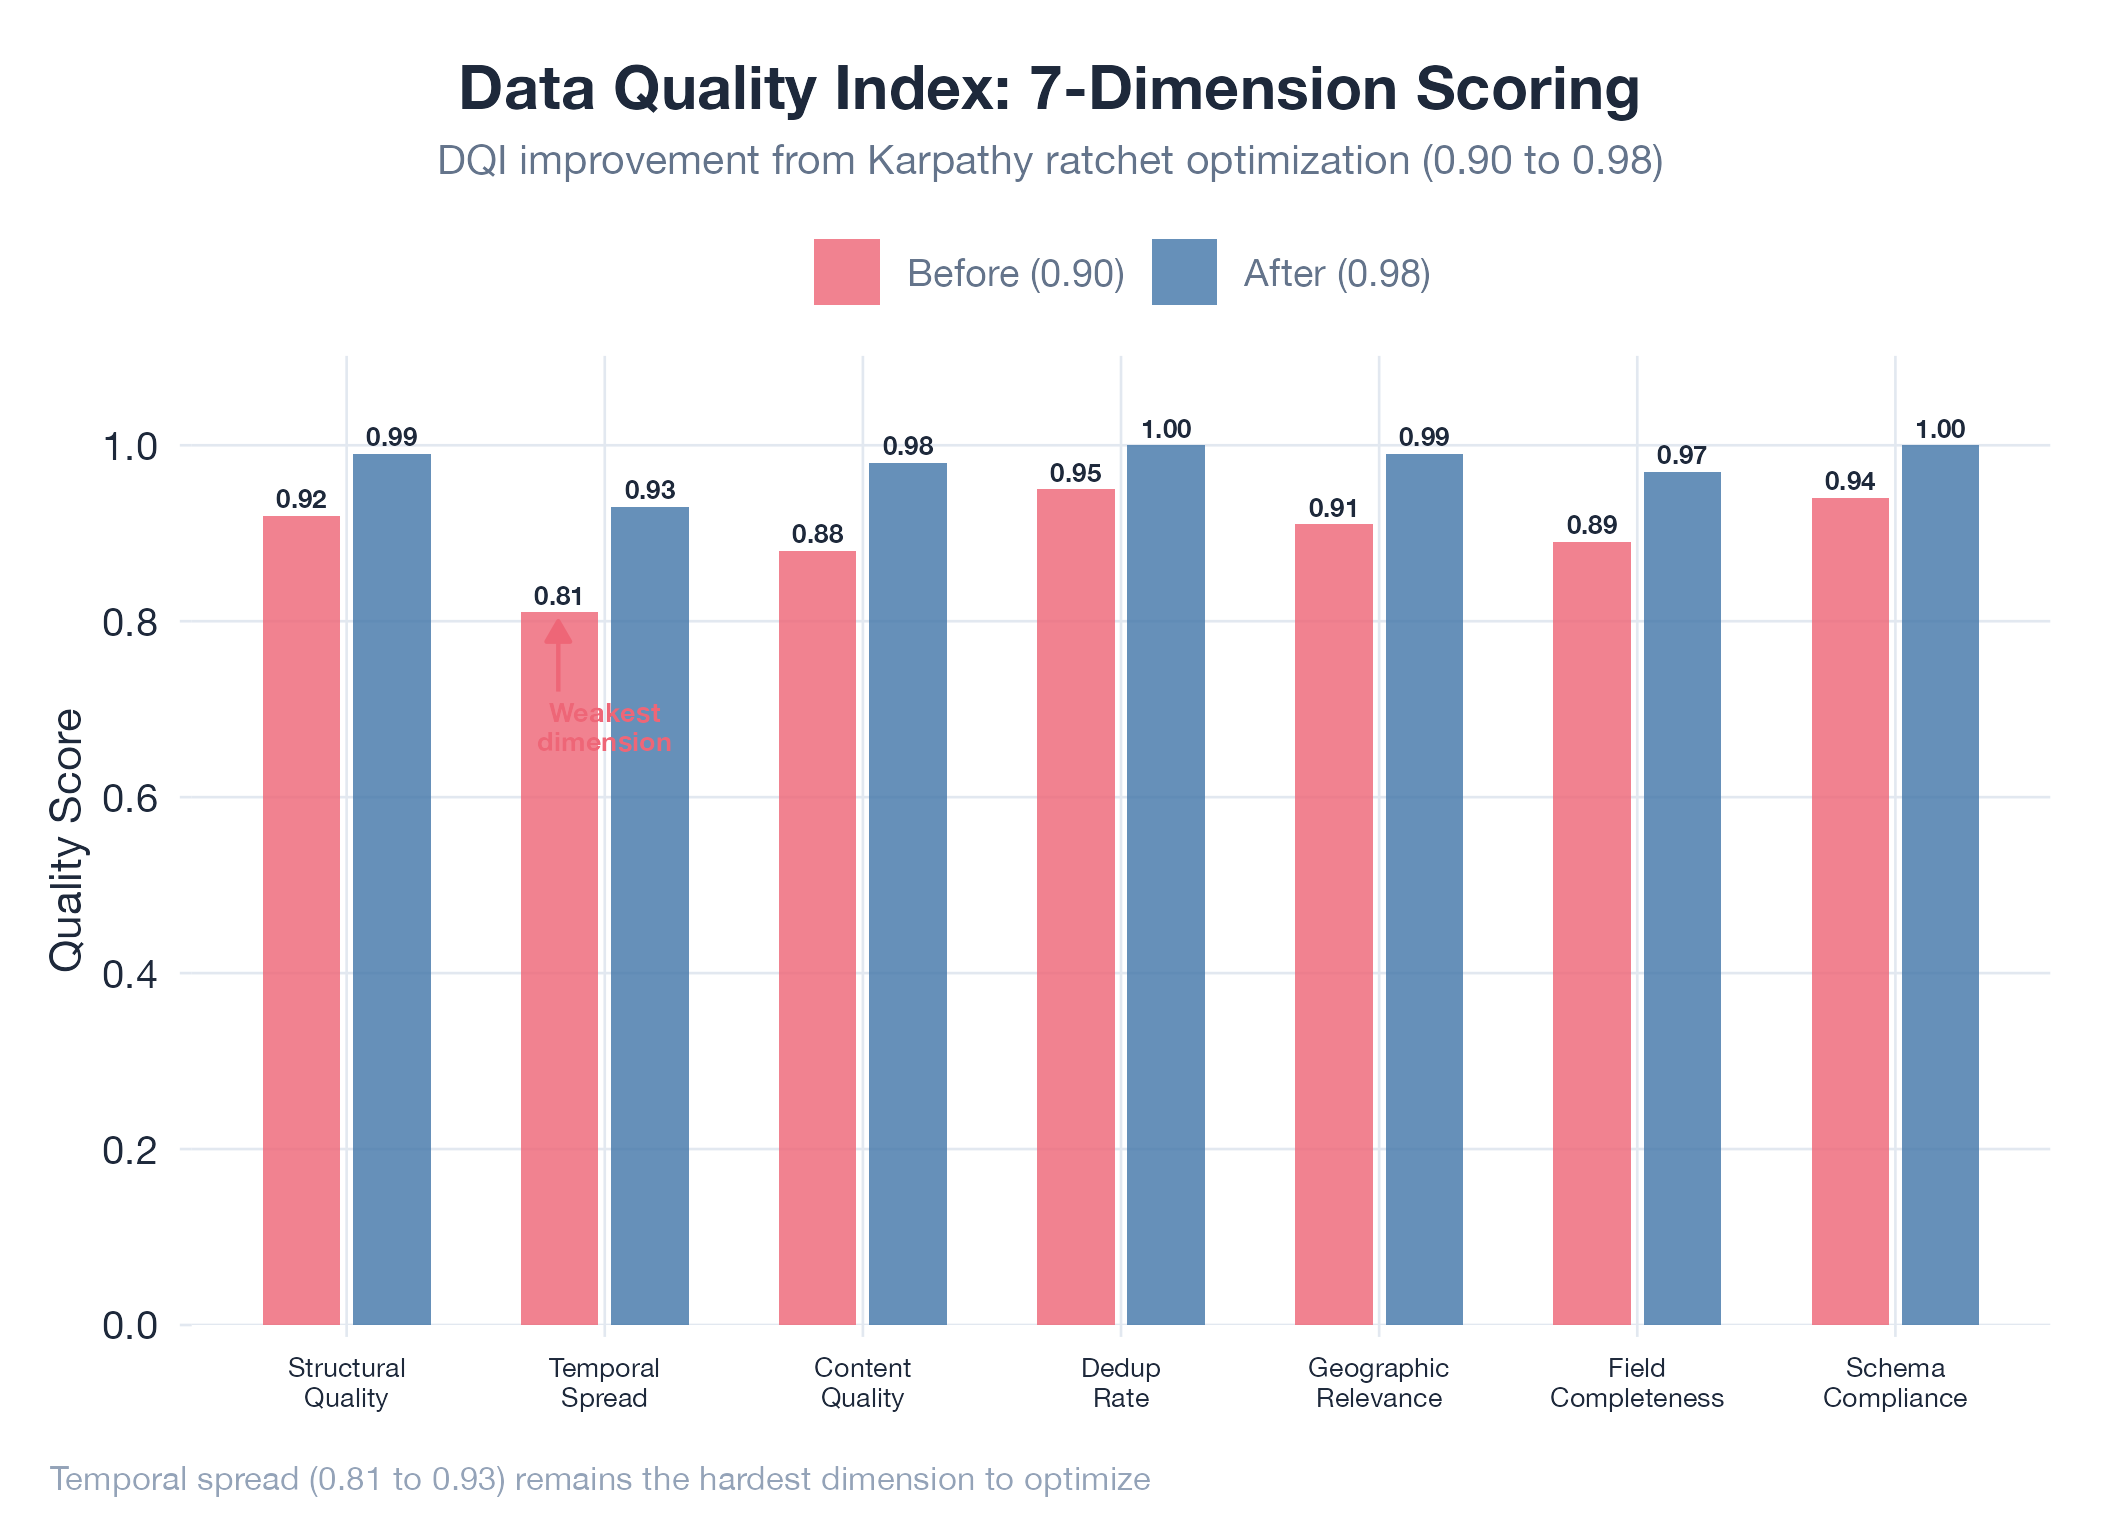
The internal audit pipeline drove DQI from 0.9049 to 0.9790 across 20 experiment rounds. The biggest lever was expansion horizon tuning (wider time window fixed temporal spread). Remaining weakness at 0.81 is temporal spread: event calendars are inherently lumpy. Tracked in Expansion Horizon Tuning.
Related
- Expansion Horizon Tuning
- Karpathy Ratchet
- Baseline
- Sensitivity Analysis