R visualization pipeline: 108-check quality rubric, 9 chart families, 4 brand templates
Publication-quality R visualization used to mean: write a ggplot2 script, run it, squint at the output, iterate manually. The skills/r-visualization-pipeline skill replaced that with a 108-check automated rubric that scores every chart and tells you exactly what’s wrong.
Context
Visualization quality for the projects/redcorsair/_index project was entirely ad-hoc. Each chart was a fresh ggplot2 script, styled inconsistently, validated by eye. There was no mechanism to ensure brand consistency across charts, no standard for what “good” meant numerically, and no way to catch quality regressions automatically. As the visualization surface area grew : vault breakthrough charts, oil model performance charts, job application funnel charts : the ad-hoc approach was not scaling.
The experiment that motivated the skill was brand token system development for RedCorsair, which required a reproducible way to verify that charts met brand standards after token changes.
What Changed
The skills/r-visualization-pipeline skill organizes visualization into three layers.
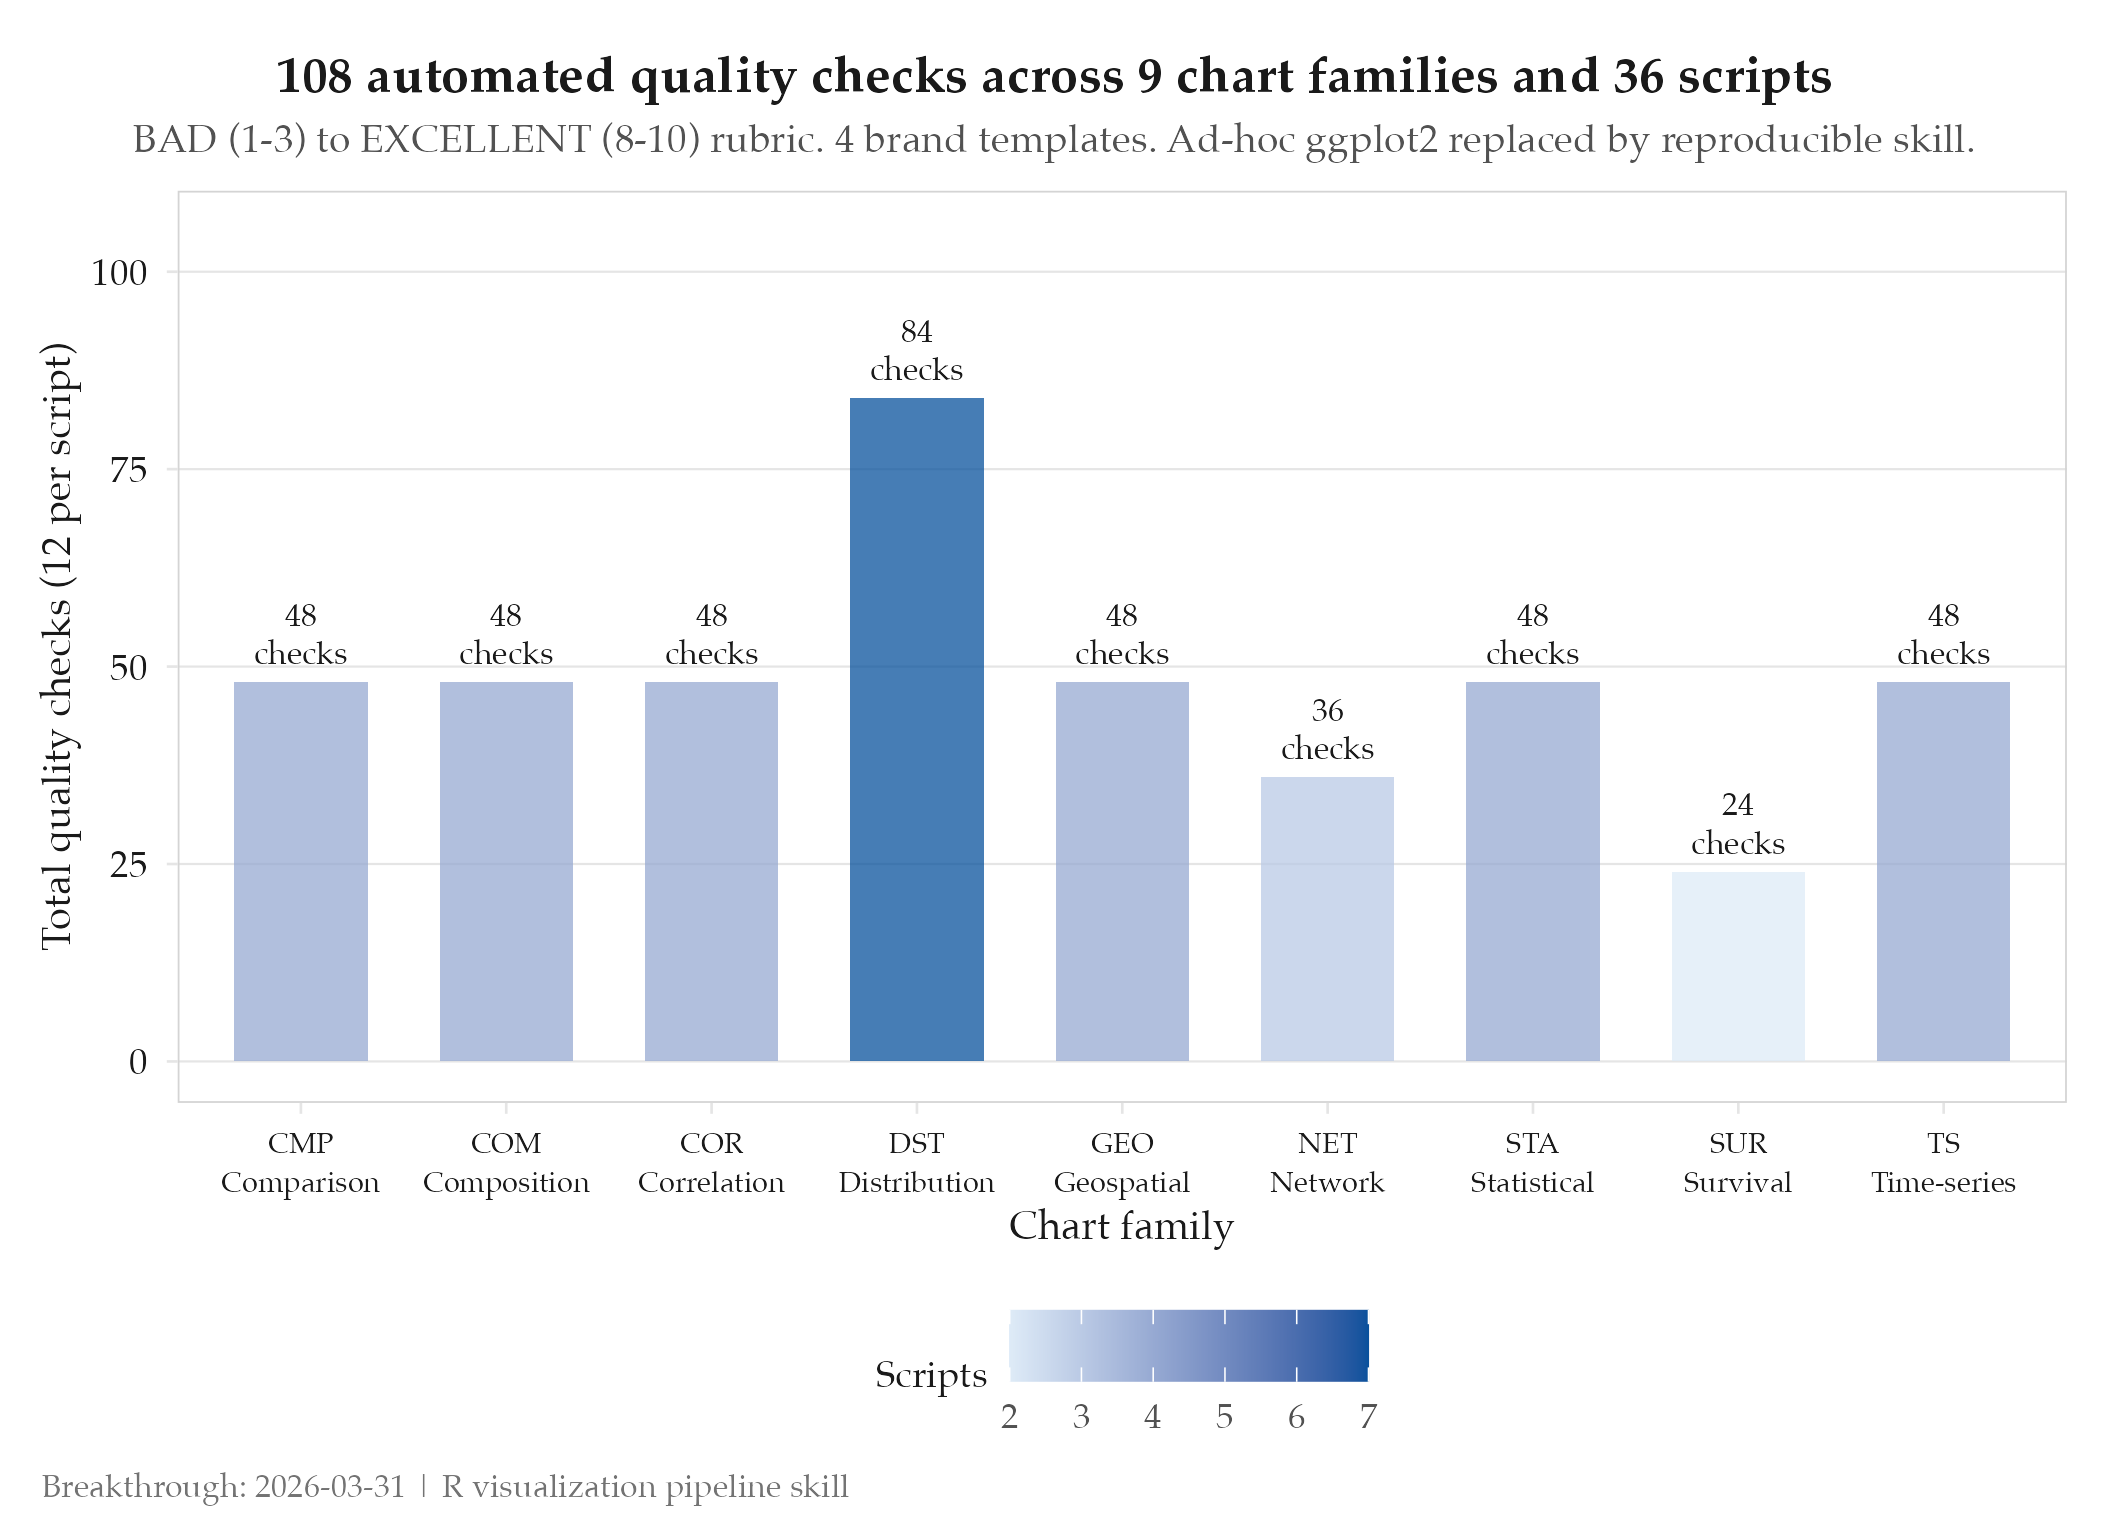
The chart family taxonomy covers 9 categories: comparison, composition, correlation, distribution, geo, network, statistical, survey, and time-series. Each family has canonical chart types, recommended ggplot2 idioms, and anti-patterns to avoid. This taxonomy prevents “which chart type should I use?” paralysis.
Four brand templates (Slate, Journal, Minimal, Dark) provide consistent color palettes, font stacks, and layout grids across all charts. Template application is a one-line function call rather than per-chart styling decisions.
The 108-check automated quality rubric scores charts on a 1-10 scale mapping to BAD (1-3), OKAY (4-5), GOOD (6-7), and EXCELLENT (8-10). Checks cover data-ink ratio, label legibility, color contrast, axis formatting, title clarity, and brand compliance. The rubric runs automatically on chart output and returns structured feedback with specific failing checks.
Impact
Before: ad-hoc ggplot2, no quality standard, manual review, brand inconsistency. After: 9 chart families with documented idioms, 4 brand templates, 108-check automated rubric, consistent quality scoring across all vault visualizations.
The rubric is the key unlock. “Does this chart meet the standard?” is now an answerable question with a number attached. Charts that score below GOOD get specific feedback explaining which of the 108 checks failed and why.
Source
- Skill: skills/r-visualization-pipeline
- Pitfall: topics/pitfalls/redcorsair-method-signature-drift
- Experiment: 001-brand-token-system