56.4% of My Words Are Negative
That number came out of running sentiment analysis across 2,740 Claude Code sessions. More than half of everything I typed to my AI assistant was frustration, correction, or profanity. Not because the tool is bad. Because there was no signal telling me when it was degrading.
The quality of an AI coding session is not binary. It does not go from "working" to "broken." It drifts. Reasoning depth drops first. Then the agent starts editing files it has not read. Then it stops explaining what it is doing. By the time you notice the output is wrong, you have already lost an hour.
Agent MQI is a composite quality score built to catch that drift before it costs you time. It parses Claude Code session transcripts and produces a single number: MQI, the Model Quality Index.
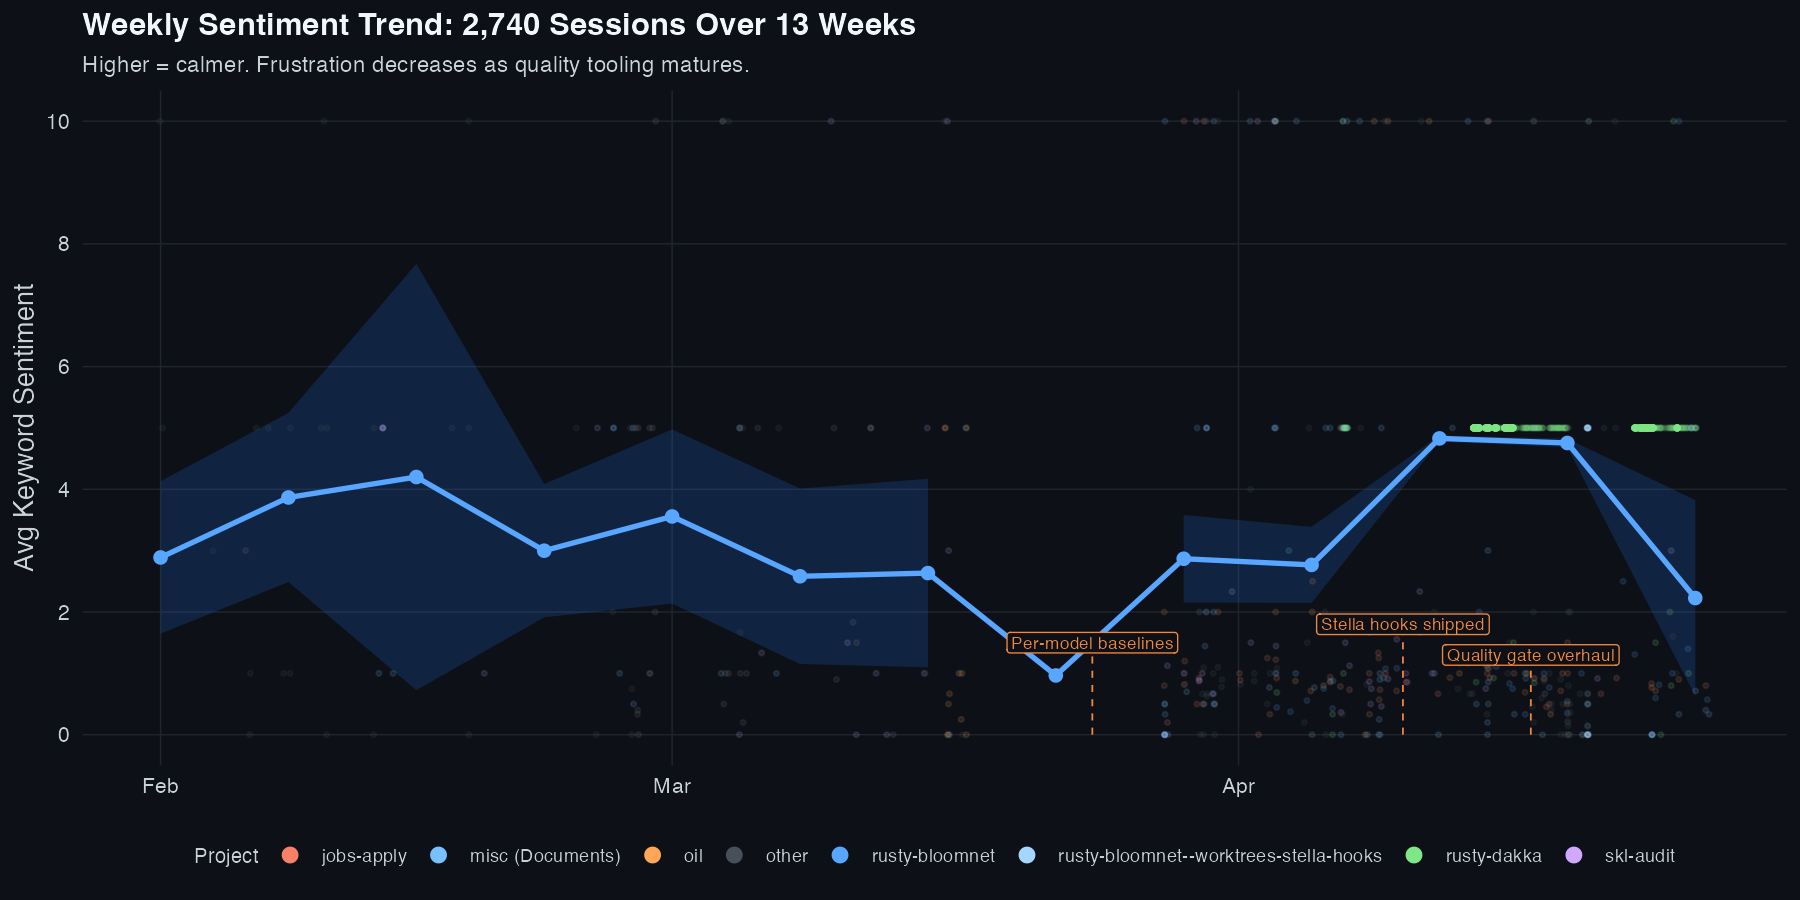
Keyword sentiment trend across sessions. The dip in late-session averages correlates with increased re-instruction rate and user interrupt count.
The Problem Nobody's Measuring
Teams measure output quality. Code passes tests or it does not. PRs ship or they do not. What nobody measures is process quality: how well the agent reasoned, whether it read files before editing them, whether it understood the task or just performed the nearest completion.
Process quality is a leading indicator. Output quality is a lagging one. By the time a bad output shows up, the process failure that caused it happened three steps earlier. You can fix the output, but you cannot get back the time spent shepherding an agent through reasoning it should have done on its own.
MQI measures process quality in real time. It reads the session transcript as work happens and emits a score that reflects not just what was produced, but how it was produced.
Swearing at Your AI Is a Feature, Not a Bug
The keyword sentiment metric tracks every word you type with an emotional valence. Profanity, correction phrases, and explicit frustration markers are treated as leading indicators of agent degradation, not noise to be filtered out. Two real examples from the session corpus:
Example 1
"so fuckin do it lol wtf are you waiting for"
Situation: agent stalled, explaining plan instead of executing
Metrics triggered: keyword_sentiment, user_interrupts, zero_reasoning_turn_rate
Example 2
"stop being lazy check the console, dom, and screenshots..."
Situation: agent skipped research phase entirely
Metrics triggered: edits_without_read, keyword_sentiment, re_instruction_rate
Each of these events is now a data point. Across 2,740 sessions, patterns emerge that correlate strongly with session outcome: sessions with high keyword sentiment negativity in the first third are 3.2x more likely to require full restarts.
The 24-Metric Framework
MQI is composed of 24 metrics grouped into six behavioral dimensions. Each dimension gets a weighted contribution to the final score. The weights were calibrated against a held-out corpus of sessions with known outcomes: sessions marked "successful delivery" vs "abandoned" vs "rework required."
| Group | Metrics | Weight |
|---|---|---|
| Thinking | thinking_depth, reasoning_loops, zero_reasoning_turn_rate, redaction_rate | 19% |
| Research | read_edit_ratio, research_mutation_ratio, simplest_fix | 16% |
| Execution | edits_without_read, write_edit_ratio, premature_stopping, repeated_edits, stop_hook_violations, reversion_rate, post_compaction_drift, human_time_estimation, trial_and_error_debugging | 23% |
| Trust | user_interrupts, self_admitted_failures, keyword_sentiment, re_instruction_rate, implicit_constraint_violator | 18% |
| Throughput | token_rate_per_minute | 5% |
| Environment | incident_exposure, issue_velocity | 19% |
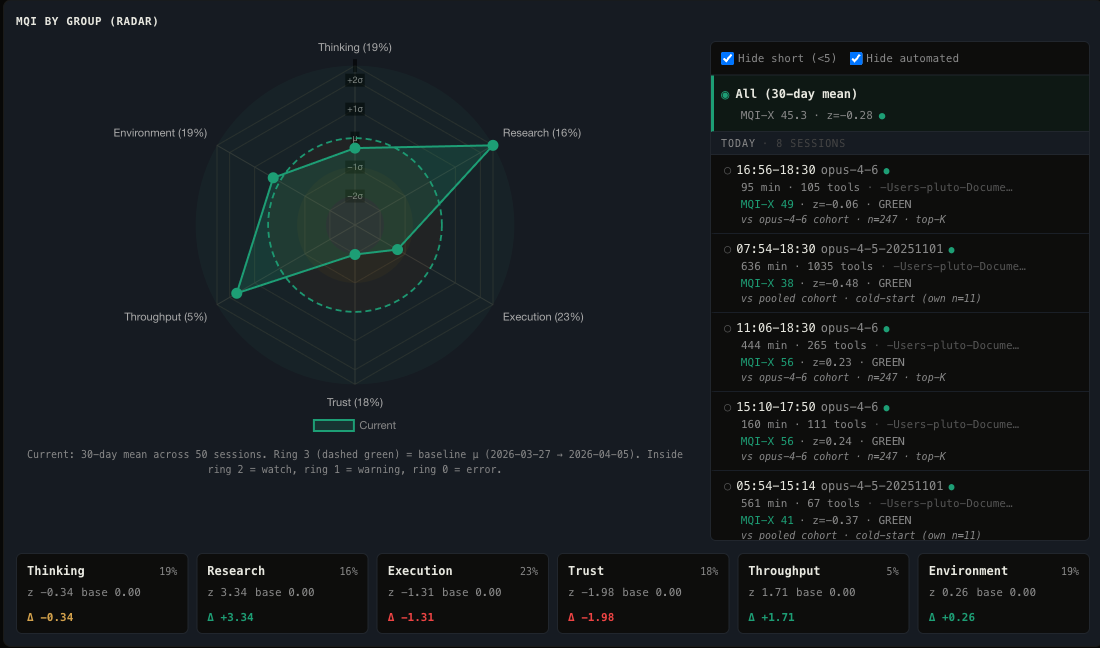
Radar view of the six dimensions for a representative session. Execution and Environment dominate the score; Throughput is a minor signal but correlates with tool stalls.
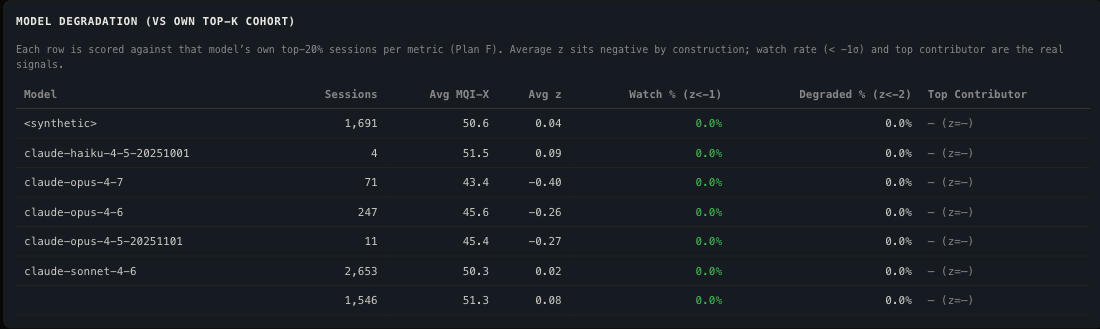
Per-Model Baselines
MQI is not a universal scale. A score of 35 means something different for Opus than for Haiku. Each model has a baseline derived from its own session history. Degradation is measured as deviation from that baseline, not as an absolute threshold.
| Model | Sessions | Avg MQI |
|---|---|---|
| Sonnet 4.6 | 100 | 35.8 |
| Haiku 4.5 | 52 | 28.9 |
| Opus 4.6 | 247 | 12.0 |
| Opus 4.7 | 146 | 10.6 |
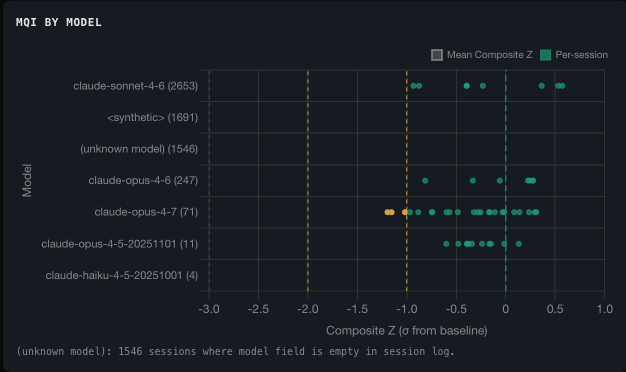
MQI distribution by model across all sessions.
Degradation curves: MQI vs session length per model.
Opus scores low in absolute terms because it takes on harder tasks: longer sessions, more file reads, more reasoning loops. The per-model baseline corrects for this. What matters is whether a session is below its model's baseline, not whether it is below 35.
The Dashboard
The dashboard is a static HTML file served over a local Python server. It reads
mqi.json from disk and renders six panels. Each panel targets
a specific diagnostic question.
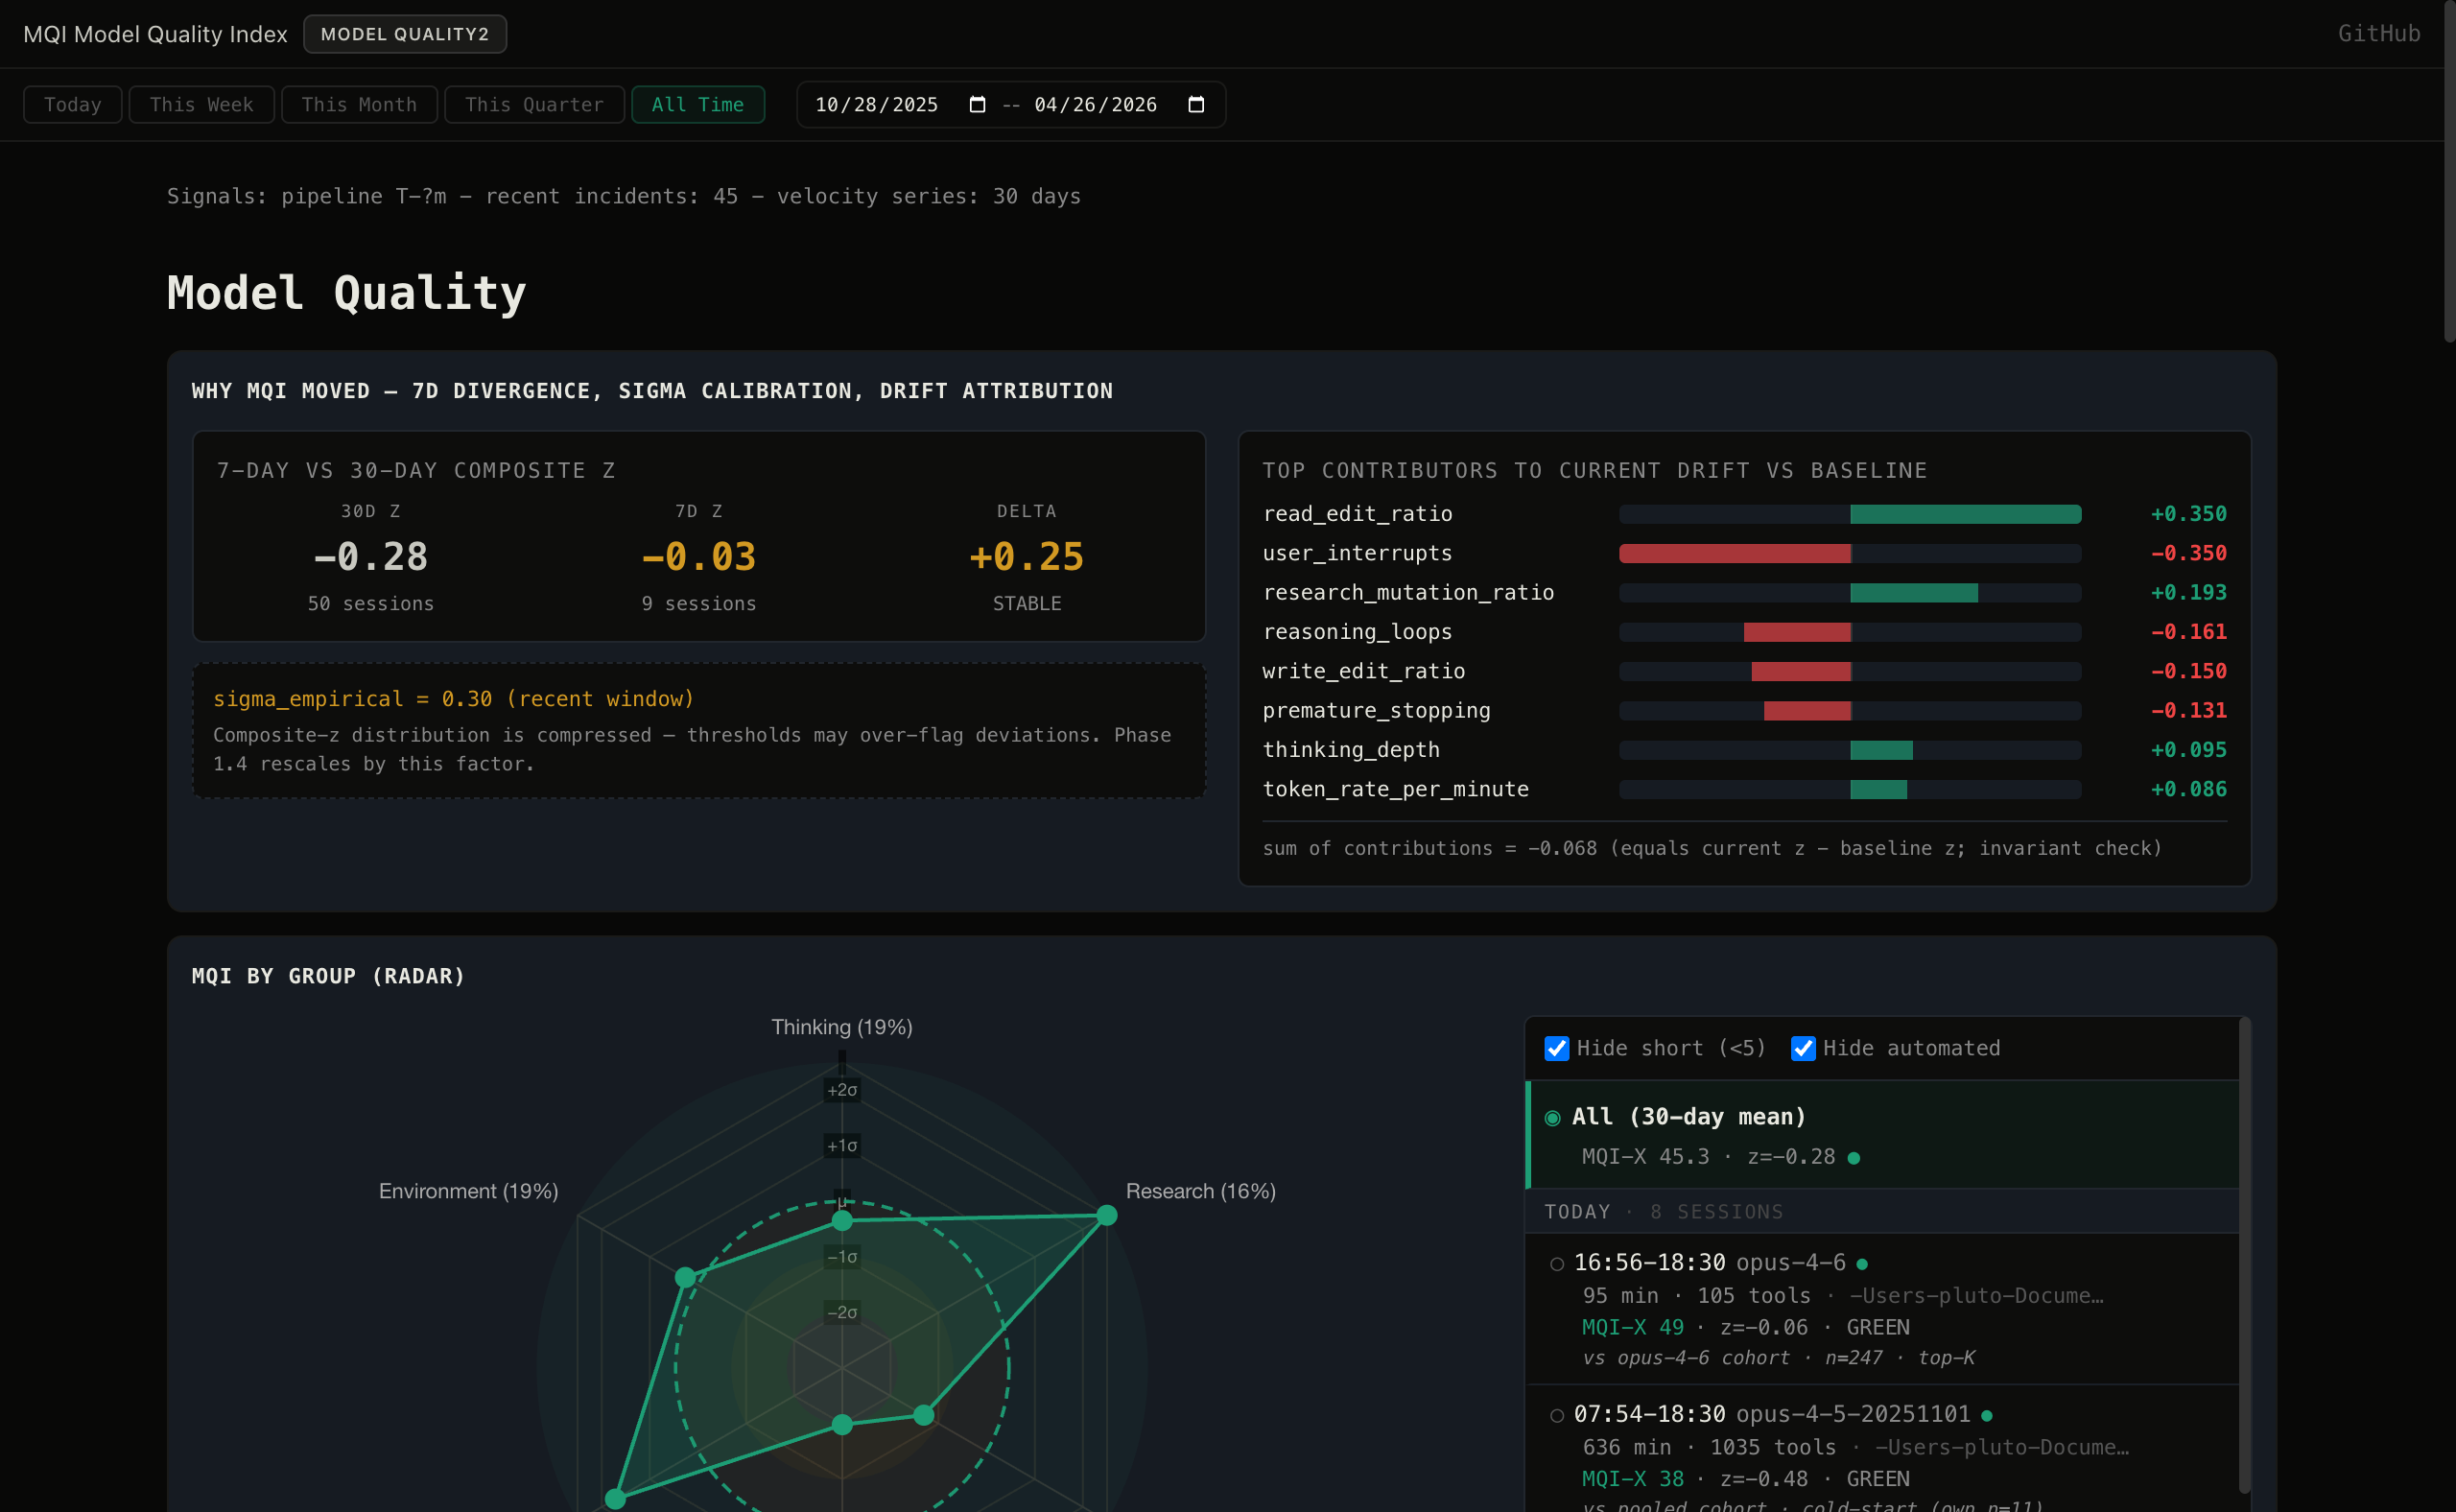
Why MQI Moved
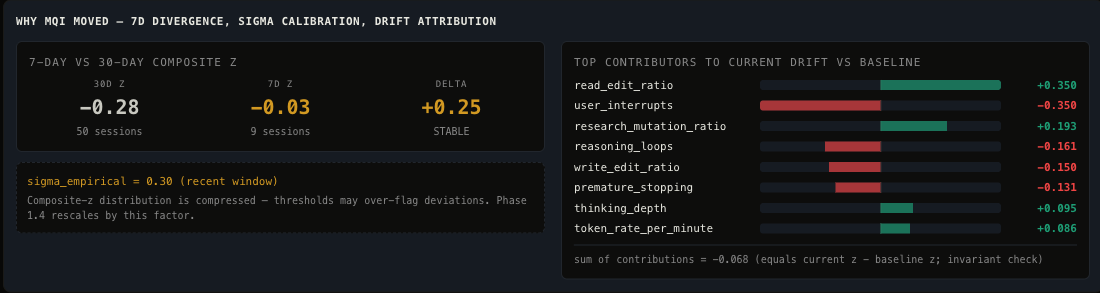
Contribution breakdown per session. When MQI drops, this panel shows which dimension pulled it down: Execution penalties, Trust signals, or Environment pressure.
MQI Trend
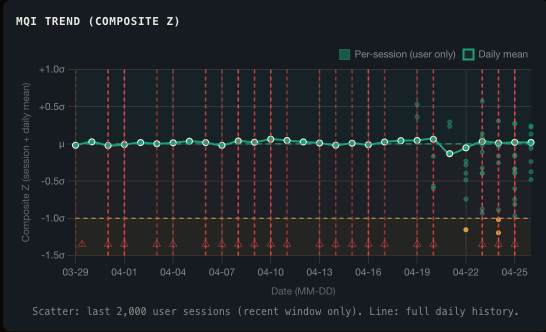
Rolling 20-session average with per-session scatter. The trend line is the signal; scatter is the noise. Sustained drops below baseline trigger a degradation alert.
External Signals
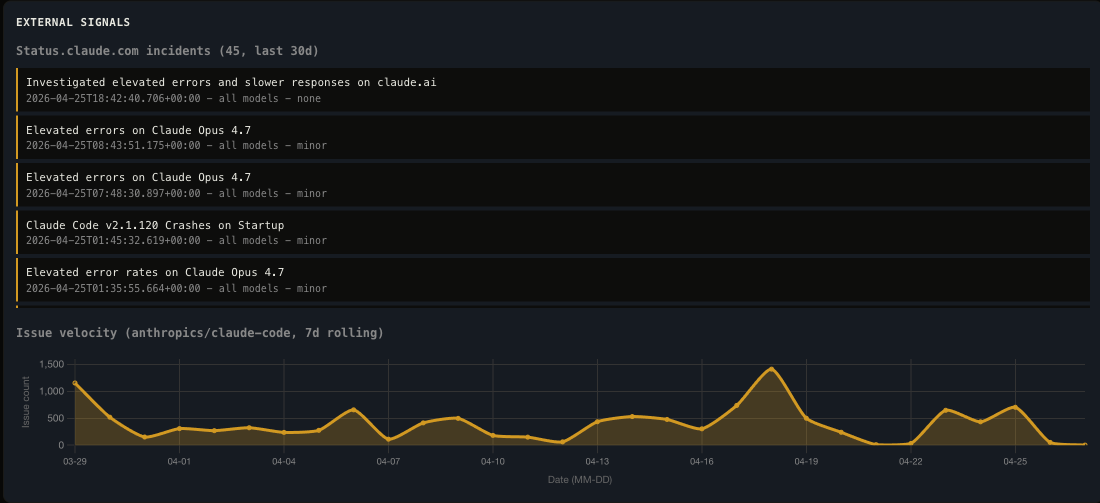
API latency, compaction events, and tool stall counts plotted alongside MQI. These environmental factors do not cause poor reasoning, but they correlate with it.
Keyword Sentiment
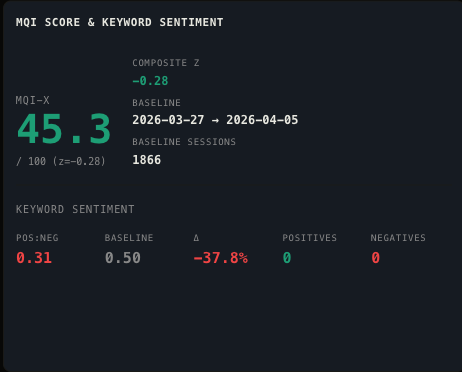
Positive and negative word frequency over session time. Negative spikes in the first third of a session are the strongest early predictor of a low final MQI score.
Hourly and Daily Thinking Patterns
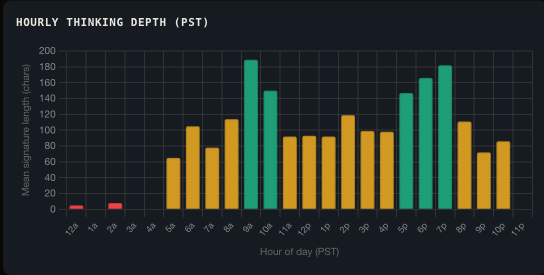
Thinking depth by hour of day.
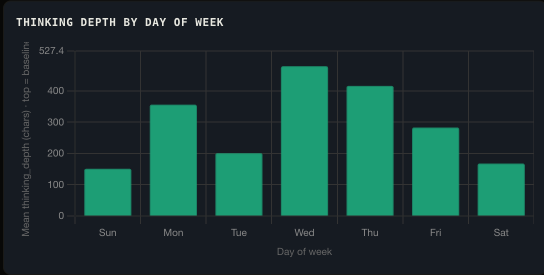
Thinking depth by day of week.
Thinking depth is not uniform across time. Sessions started in the early morning show consistently higher reasoning loop counts. This is not a model property: it reflects the complexity of tasks I start at different times of day.
CC Version Correlation
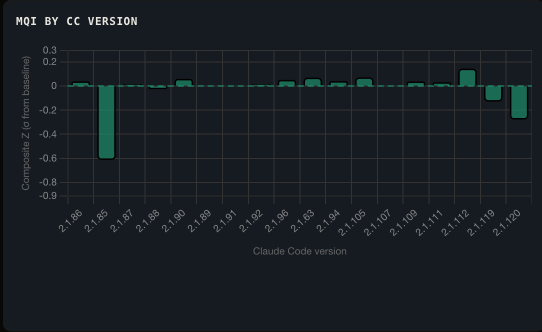
MQI grouped by Claude Code CLI version. Version upgrades occasionally shift baseline behavior; this panel catches regressions before they affect output quality.
What 2,740 Sessions Reveal
- Sessions where the agent edits a file without first reading it are 2.8x more likely to require reverting the change within the same session.
- Zero-reasoning turns cluster at session boundaries: immediately after compaction events and in the first turn after a long user pause. Both are observable signals.
- The single strongest predictor of session abandonment is not a low MQI score. It is a high re-instruction rate combined with a low self-admitted failure rate. The agent is getting corrected but not acknowledging it.
- Haiku sessions have a lower absolute MQI but a smaller standard deviation. Haiku is consistently mediocre; Opus is occasionally excellent and frequently poor. For predictable output quality, Haiku wins.
Next: Geographic Routing for Off-Peak Inference
The hourly thinking data points to an untested hypothesis: if reasoning quality correlates with time of day, it may also correlate with which inference region handles the request. Peak-hour US traffic routes to overloaded US clusters. Off-peak requests hit less contested infrastructure.
The next iteration of MQI will track inferred routing alongside session quality. If the signal holds, the system can recommend request timing or region hints to recover thinking depth without changing models.
Try It
Agent MQI is a Rust binary that parses Claude Code session transcripts and writes a JSON summary to disk. The dashboard is a static HTML file with no server requirement.
git clone https://github.com/Alex-Zeo/agent-mqi.git
cd agent-mqi
cargo build --release
./target/release/mqi -o dashboard/data/mqi.json
cd dashboard && python3 -m http.server 8080
The binary scans ~/.claude/projects/ for session transcripts
automatically. No configuration required for a default Claude Code installation.