Visual Inspection Catches What Metrics Miss
A Human Looking at the Chart Caught What Every Automated Metric Missed
What Happened
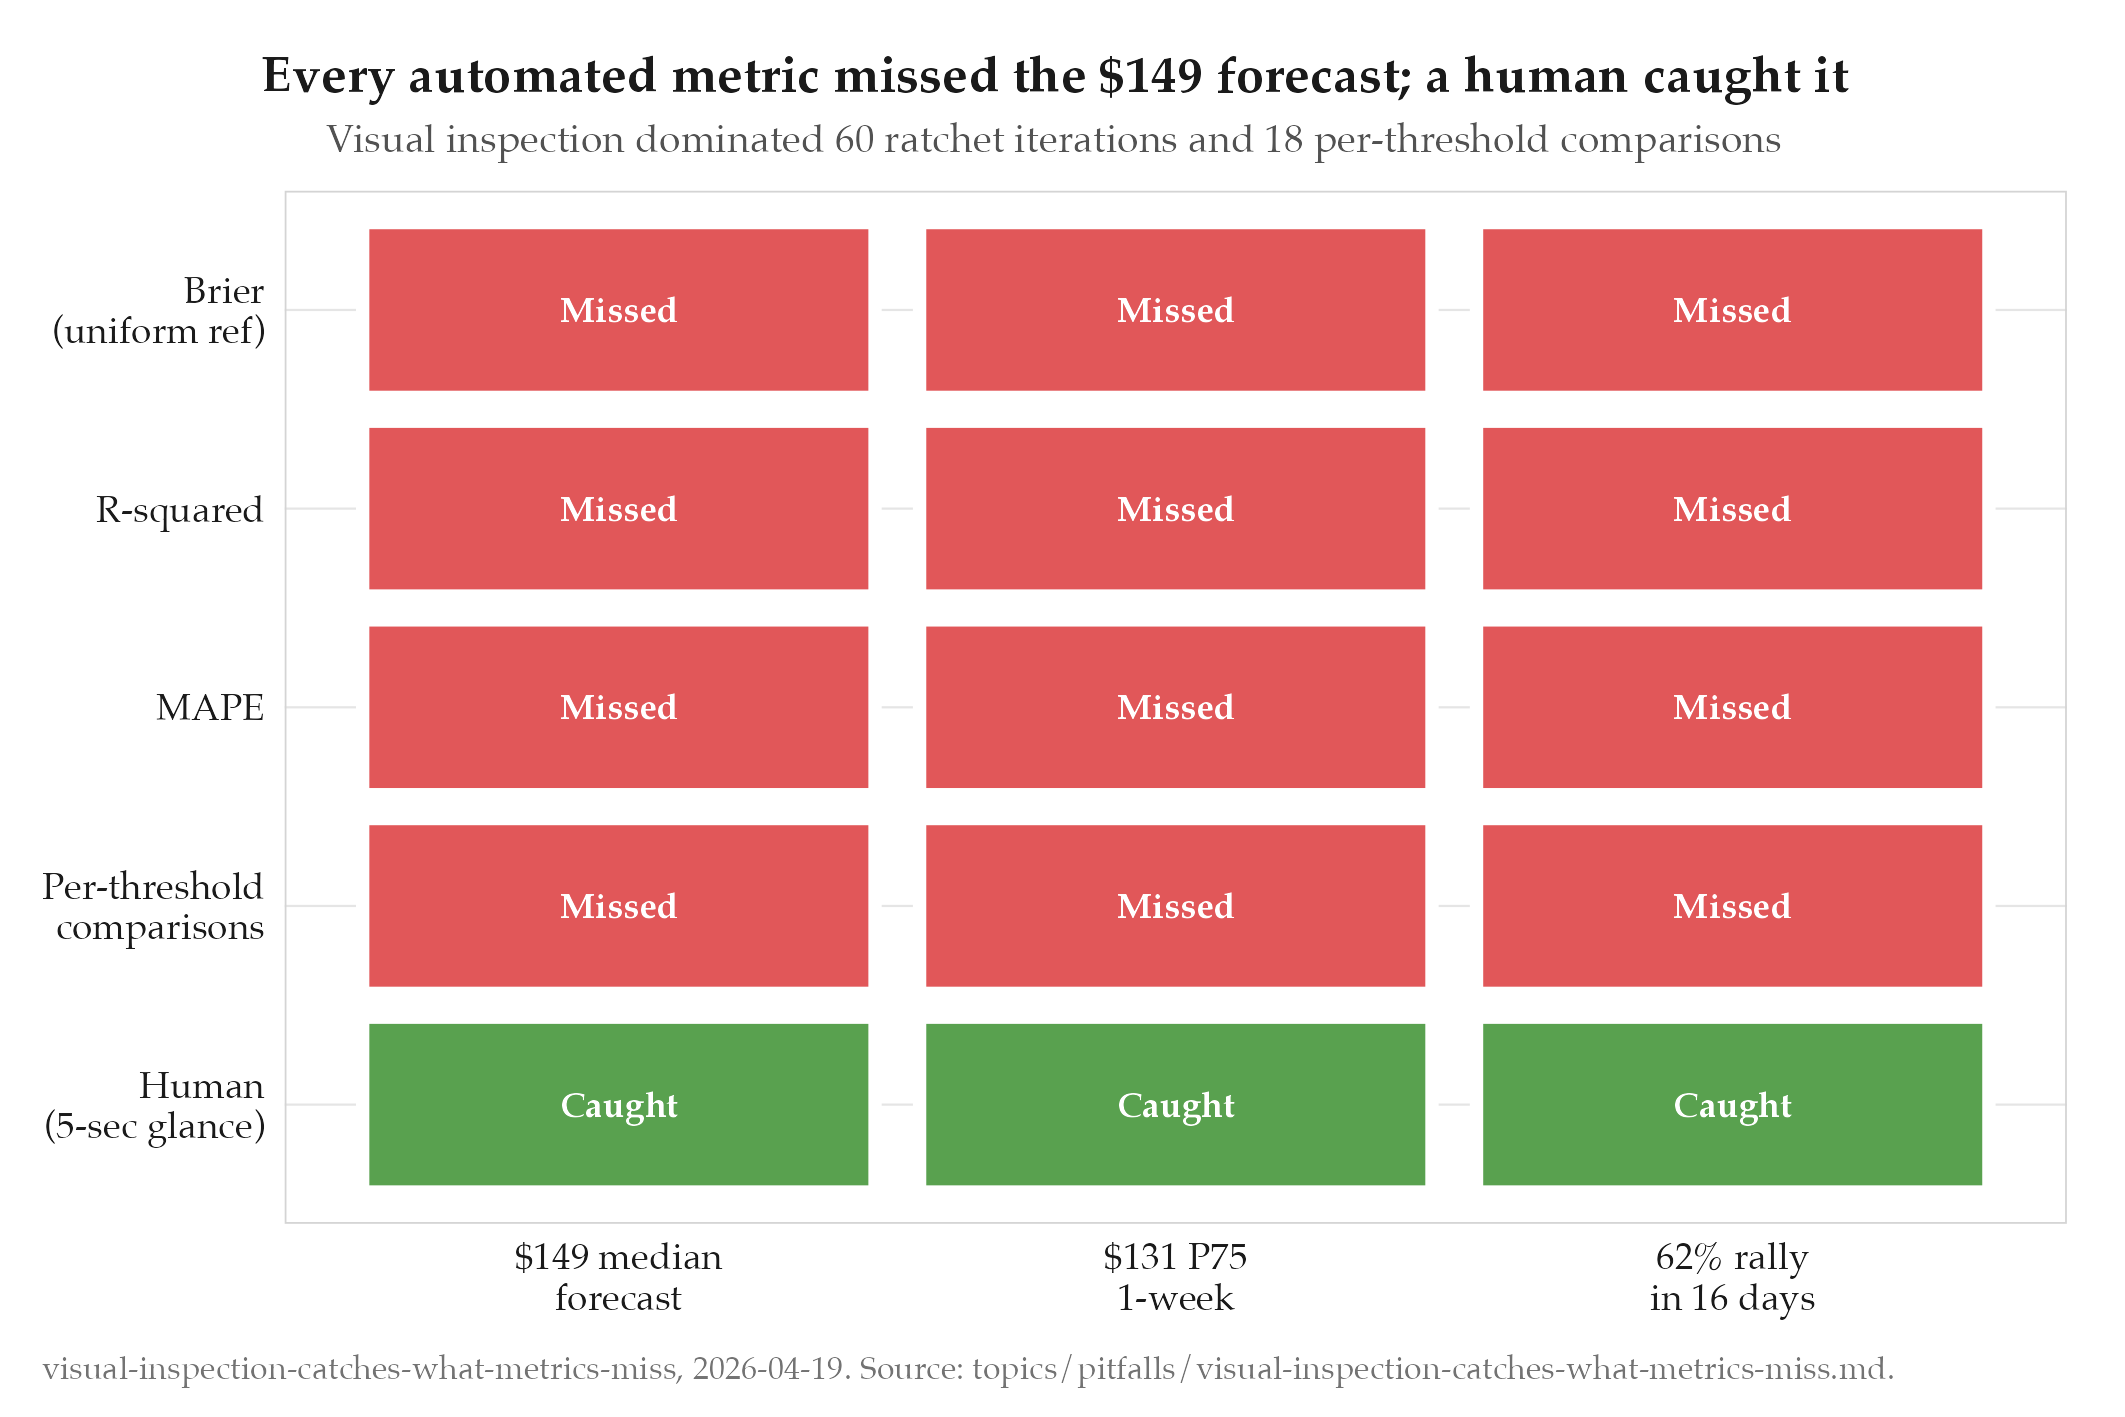
The oil model’s Karpathy ratchet ran two rounds of optimization and reported “BEATING BOTH PLATFORMS ON ALL THRESHOLDS” with +25.52pp Brier advantage over Polymarket and +2.23pp over Kalshi. Every automated metric said the model was winning.
A human looked at the forecast chart and asked: “why are we forecasting oil will be $149 by April 15? isn’t that like a 1.5x multiplier from where we are today?”
WTI was at $92.38. The model’s median 1-week forecast was $118. The P75 was $131. The mean peak was $139. A 1.5x overnight move would be the largest single-day oil move in history. The model was projecting this as the MEDIAN outcome.
No automated metric flagged this because:
- Brier score under uniform reference rewarded maximum bullishness (Goodhart’s Law)
- R² and MAPE measured historical fit (backward-looking), not forward reasonableness
- Calibration penalty wasn’t implemented yet
- Per-threshold comparisons showed “model wins” at every threshold because the scoring function was gameable
Root Cause
The automated pipeline had no “sanity check” step. Every metric was either backward-looking (R², MAPE, direction accuracy) or computed against a gameable reference (Brier under uniform). No metric asked the simple question: “is a 60% rally in 16 days a reasonable median forecast?”
The human spotted it instantly by looking at the Y-axis of the forecast chart: the line went from $92 today to $118-$149 within days. No quant model should project a 1.5x move as the median outcome without extraordinary justification.
Fix
Three layers:
- Calibration-proper scoring: market-implied reference + squared-deviation penalty prevents the ratchet from gaming the metric
- Structural MC fixes: proportional anchor, known ceasefire injection, faster recovery rates make the forward forecast consistent with spot price
- Visual validation: the forecast chart on the public dashboard serves as a permanent sanity check. If the model projects absurd moves, anyone can see it.
Lessons
- Automated metrics are necessary but not sufficient. A human looking at the output for 5 seconds caught what 60 ratchet iterations, 5 diagnostic scripts, and 18 per-threshold Brier comparisons all missed.
- Forward forecasts need sanity bounds. Any model that projects a median move > 20% in a week should trigger an automatic flag, regardless of what the scoring metrics say.
- Deploy the dashboard early. The public dashboard at alejandro-gutierrez.com/projects/oil/ makes the model’s predictions visible. If it shows absurd numbers, someone will notice. That’s a feature, not a bug.
- The simplest question is the most powerful audit. “Does this number make sense?” beats any scoring rule.