Brier Uniform Reference Gaming
Brier Score Under Uniform Reference Rewarded Maximum Bullishness
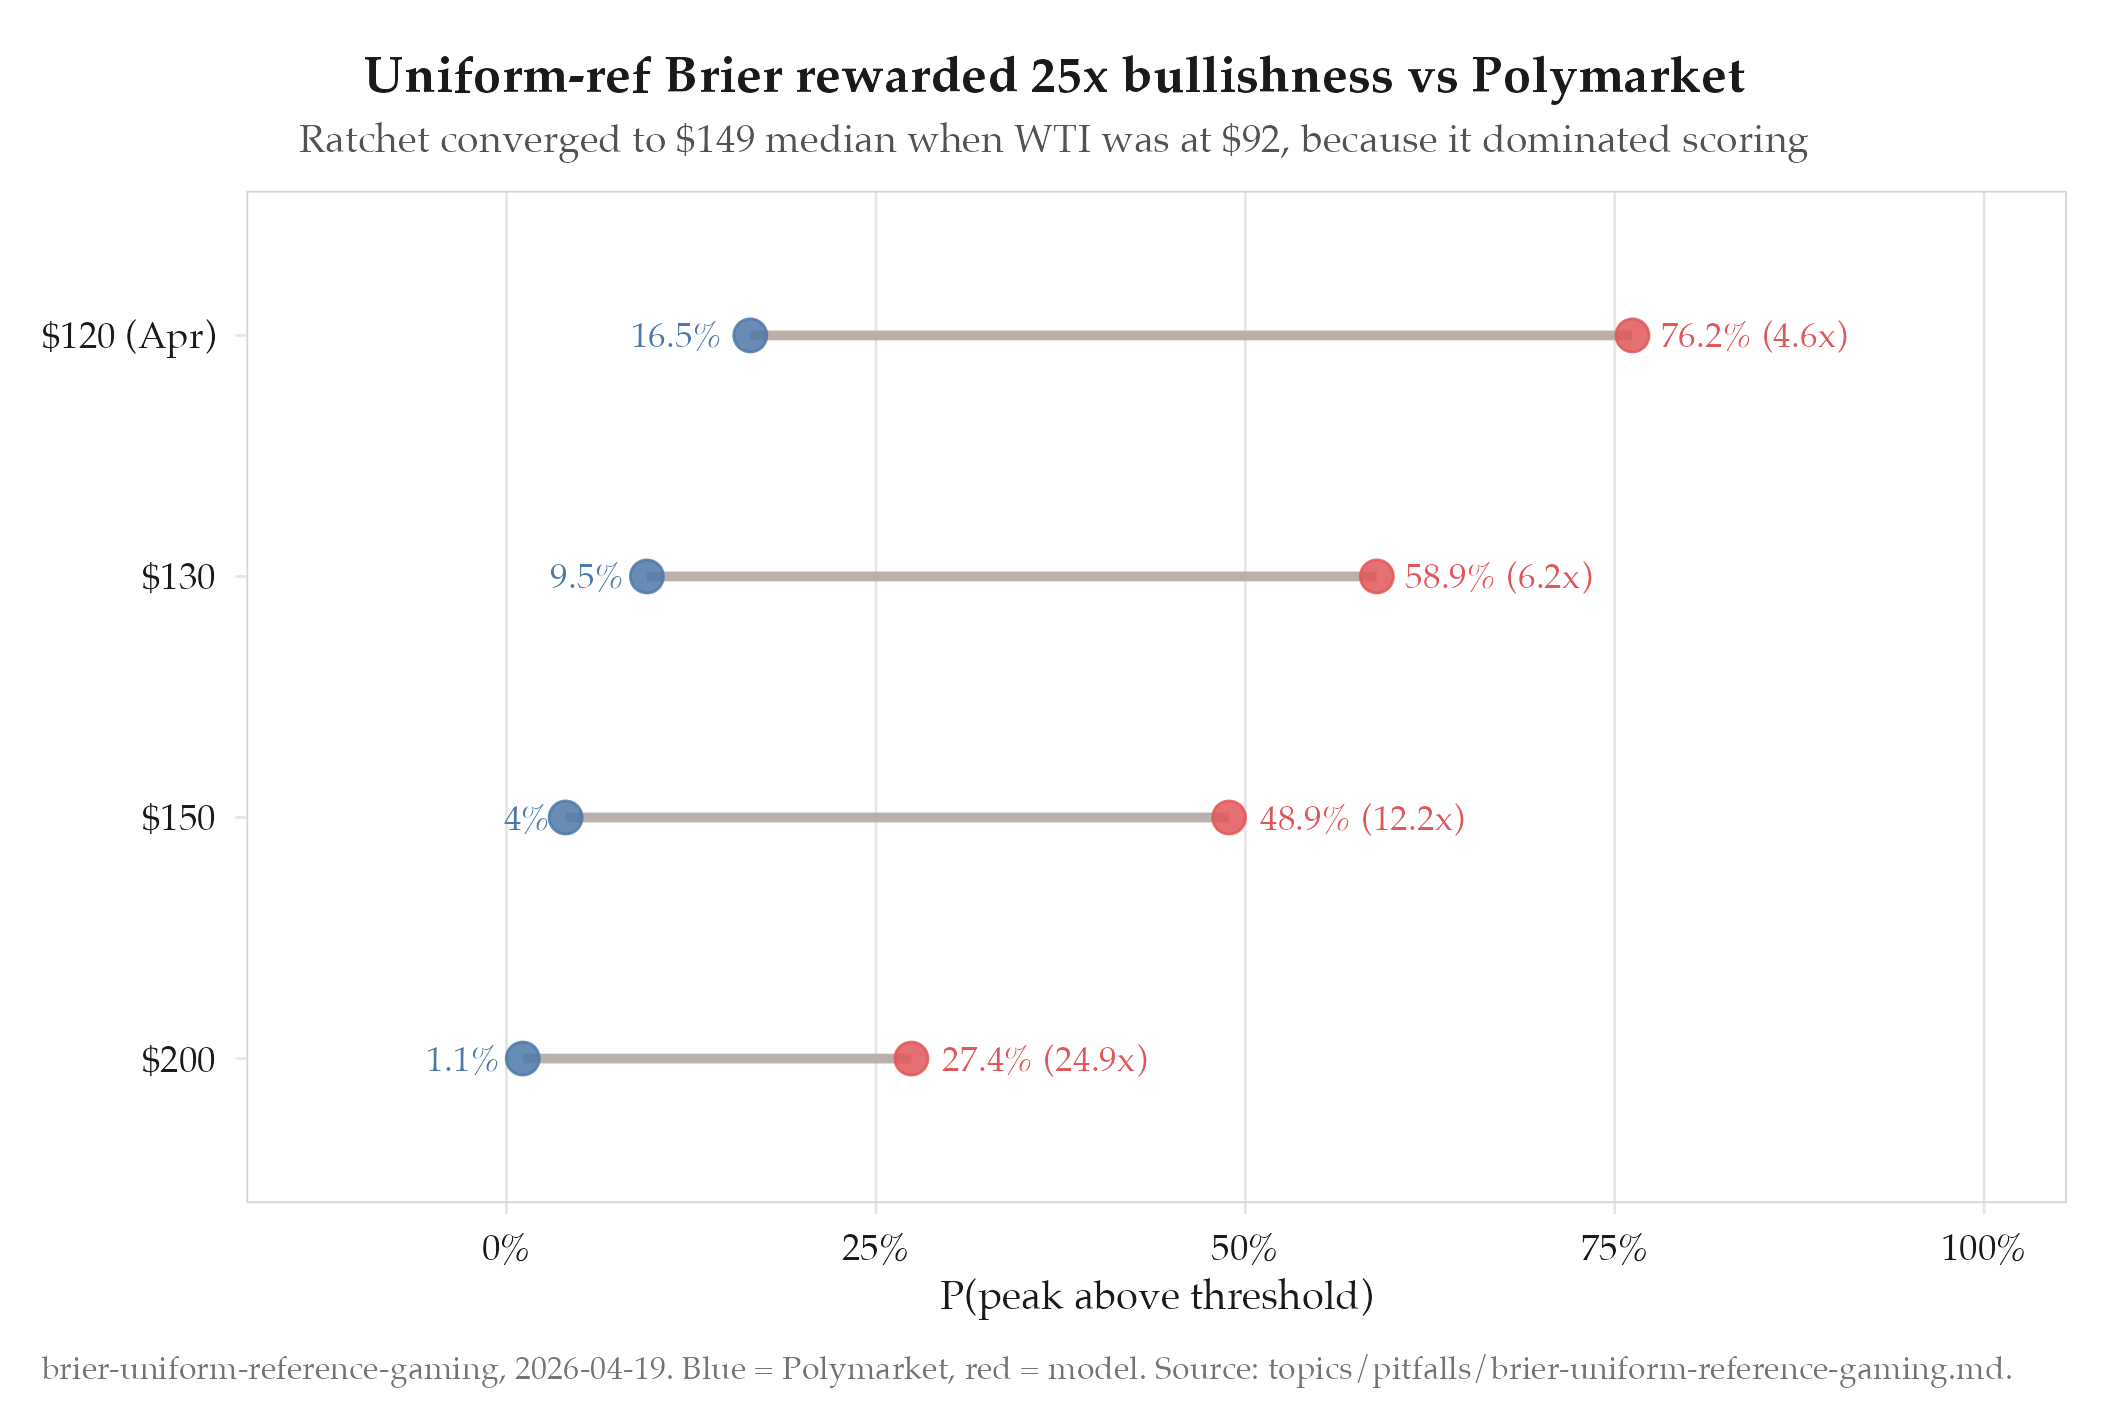
What Happened
The v25 Karpathy ratchet optimized forward MC parameters to beat Polymarket and Kalshi on per-threshold Brier score. The ratchet converged to model probabilities 5-25x higher than both prediction markets:
| Threshold | Model | Polymarket | Ratio |
|---|---|---|---|
| $120 (Apr) | 76.2% | 16.5% | 4.6x |
| $130 | 58.9% | 9.5% | 6.2x |
| $150 | 48.9% | 4.0% | 12.2x |
| $200 | 27.4% | 1.1% | 24.9x |
WTI was at $92.38 with 16 days left in April. The model claimed a 49% chance of $150 oil, a 62% rally. No credible forecaster would assign this probability.
Despite these absurd numbers, the model “beat” both platforms on every per-threshold Brier score under the uniform reference distribution.
Root Cause
The Brier comparison used a uniform reference distribution spanning $90-$220 in $5 steps. Each hypothetical peak outcome was weighted equally. This meant:
- A model predicting 76% for $120 beats one predicting 16.5% whenever the hypothetical peak is above $120, which is most of the $90-$220 range (21 of 27 buckets).
- The penalty for being wrong at $95 (where 76% is terrible) counts only once, while the “wins” at $125, $130, …, $220 count 20 times.
- The optimizer discovered that being maximally bullish dominates the metric because the reference overweights high-peak scenarios.
This is a textbook Goodhart’s Law violation: “when a measure becomes a target, it ceases to be a good measure.” The ratchet found parameter values (tailProb=0.50, upsideBias=0.35) that exploited the scoring function without producing calibrated probabilities.
How It Was Caught
Manual inspection of model probabilities against market consensus. The question was asked: “why are we forecasting oil will be $149 by April 15? isn’t that like a 1.5x multiplier from where we are today?”
Fix
Four changes implementing ICE-exchange-style quant scoring:
-
Market-implied reference distribution: Replaced uniform with midpoint blend of model and market implied PDFs. Under this reference, outcomes near $90-$100 dominate (both model and market agree these are likely). Being 50pp off from market now costs proportionally.
-
Calibration penalty: Squared-deviation from both PM and Kalshi (λ=0.5). A 10pp deviation costs 0.5pp; a 50pp deviation costs 12.5pp (25x more expensive). Treats market as Bayesian prior.
-
April <= Yearly monotonicity gate: Hard rejects proposals where April peak probability exceeds yearly peak probability (physically impossible).
-
$1 granularity thresholds: 141 thresholds matching Robinhood’s actual $1 contract intervals, up from 17 hardcoded points.
Lessons
- Never use uniform reference for Brier comparisons. The reference distribution must reflect the actual outcome probability. Market-implied midpoint is the standard approach.
- Calibration constraints are load-bearing. Without explicit penalty for deviating from market consensus, any optimizer will find parameter values that game the scoring rule.
- Always inspect output probabilities for reasonableness. A model claiming 49% chance of a 62% rally in 16 days should have been caught before the ratchet was committed.
- The market is usually approximately right. An ICE quant targets 2-5pp edges backed by structural information, not 50pp disagreements with consensus.
Deployment Validation Failure
Even after fixing the scoring, the live site at alejandro-gutierrez.com/projects/oil/ continued showing the old $149 forecast because:
- The R2 data was uploaded before the calibrated params were applied
- The public-lab quant-engine.ts was a stale fork missing all 260414 changes
- The MC had no mechanism for prices to go DOWN (additive anchor only offset $3)
- Multiple “deploy successful” claims were made without actually checking the live site
Required three additional structural fixes: proportional anchor (scales premiums by actual/model ratio), known ceasefire injection (all MC paths start from Day 39), faster post-ceasefire recovery (5%/day). Only after ALL fixes + engine sync + R2 re-upload did the live forecast show $97 instead of $149.
Lesson: “validate what you ship, not what you compute” applies to deployments too. Check the live URL before claiming success.
Redemption
The 260414b fix produces Day 46 median $97 (was $122/$149). Forward forecast consistent with $92 spot price. Public Lab live with event markers on all charts. Calibration-proper scoring prevents future Goodhart gaming.