Rewriting chart family implementations with domain-specific best practices will produce publication-quality output from AI-generated R scripts
HypothesisRewriting chart family implementations with domain-specific best practices will produce publication-quality output from AI-generated R scripts
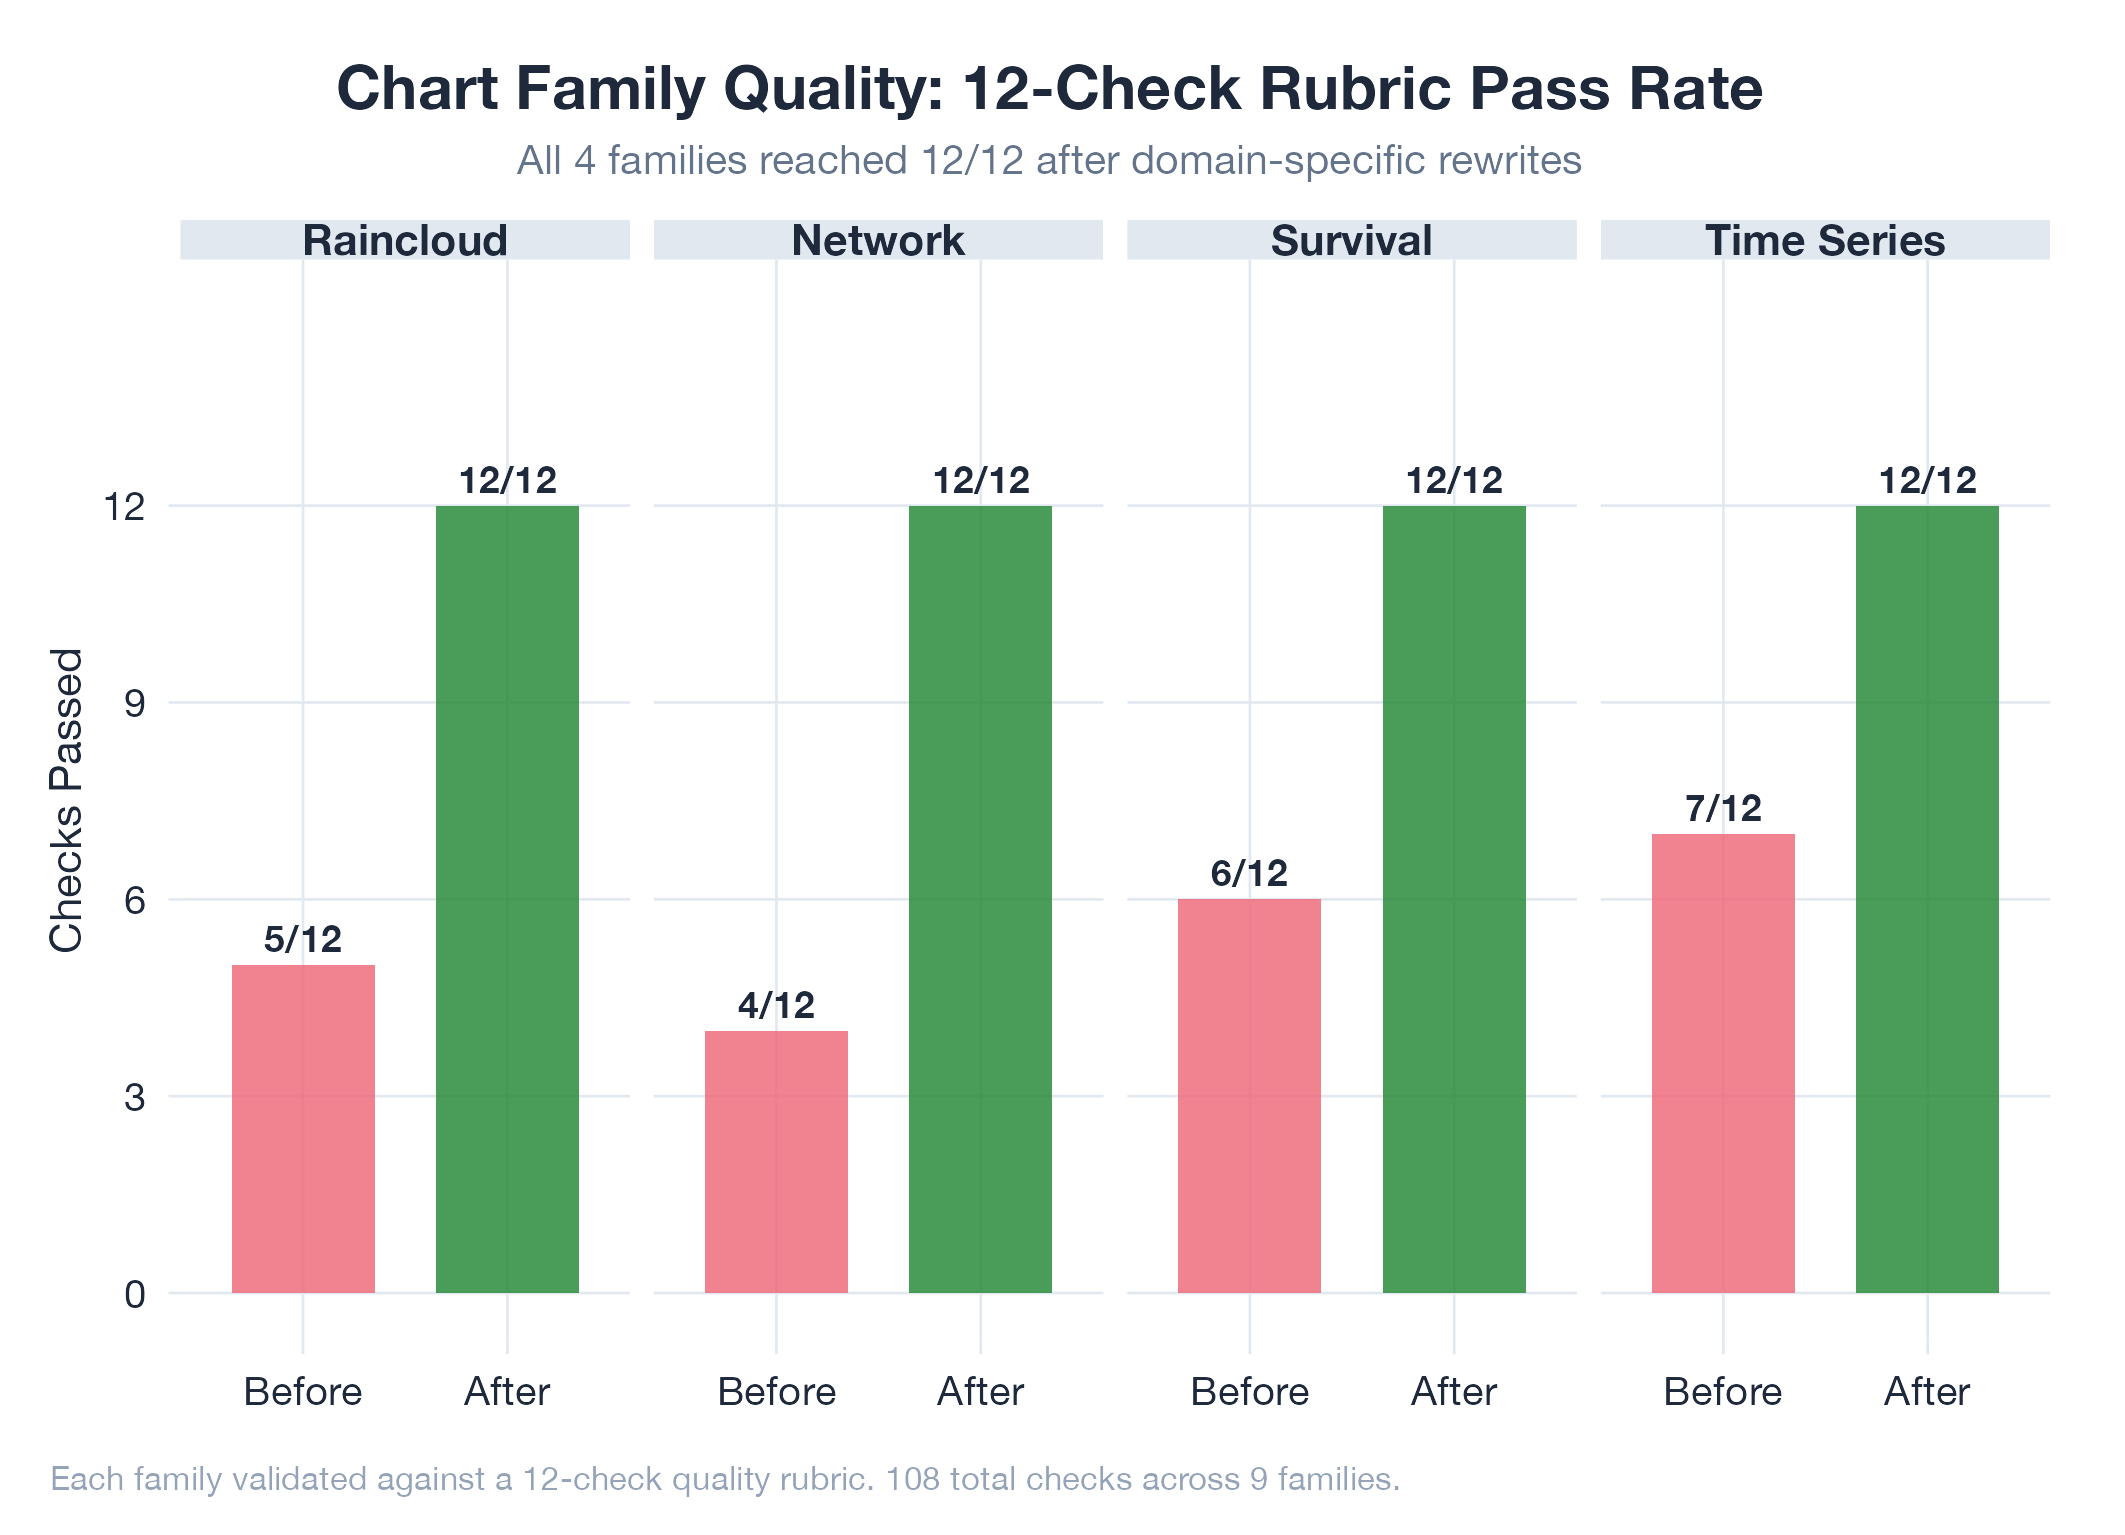
Raincloud plots (stat_halfeye + geom_boxplot + stat_dots), force-directed networks (stress layout, geom_edge_link0), Kaplan-Meier survival curves (dynamic break.time.by), multiline time series (linetype dual encoding). All passed 12-check per-family quality validation.
Changelog
| Date | Summary |
|---|---|
| 2026-04-07 | Created during temporal gap audit |
| 2026-02-26 | Original experiment |
Hypothesis
Chart family implementations using domain-specific best practices (ggdist for distributions, ggraph for networks, survminer for survival) will produce publication-quality output when generated by AI via the MCP prompt templates.
Method
Rewrote 4 chart family implementations: raincloud plots using stat_halfeye + geom_boxplot + stat_dots, force-directed networks using stress layout with geom_edge_link0, Kaplan-Meier survival curves with dynamic break.time.by calculation, and multiline time series with linetype dual encoding. Updated 4 prompt templates with 38 new implementation rules.
Results
All 4 families passed the 12-check per-family quality validation (part of the 108-check rubric). The pattern of embedding best-practice rules directly into prompt templates : rather than relying on the LLM’s training data for ggplot2 idioms : proved correct and carried forward to all 9 chart families.