Redcorsair pivot: red-team attack server to R visualization MCP
Changelog
| Date | Summary |
|---|---|
| 2026-04-07 | Created during temporal gap audit |
| 2026-02-25 | Original work |
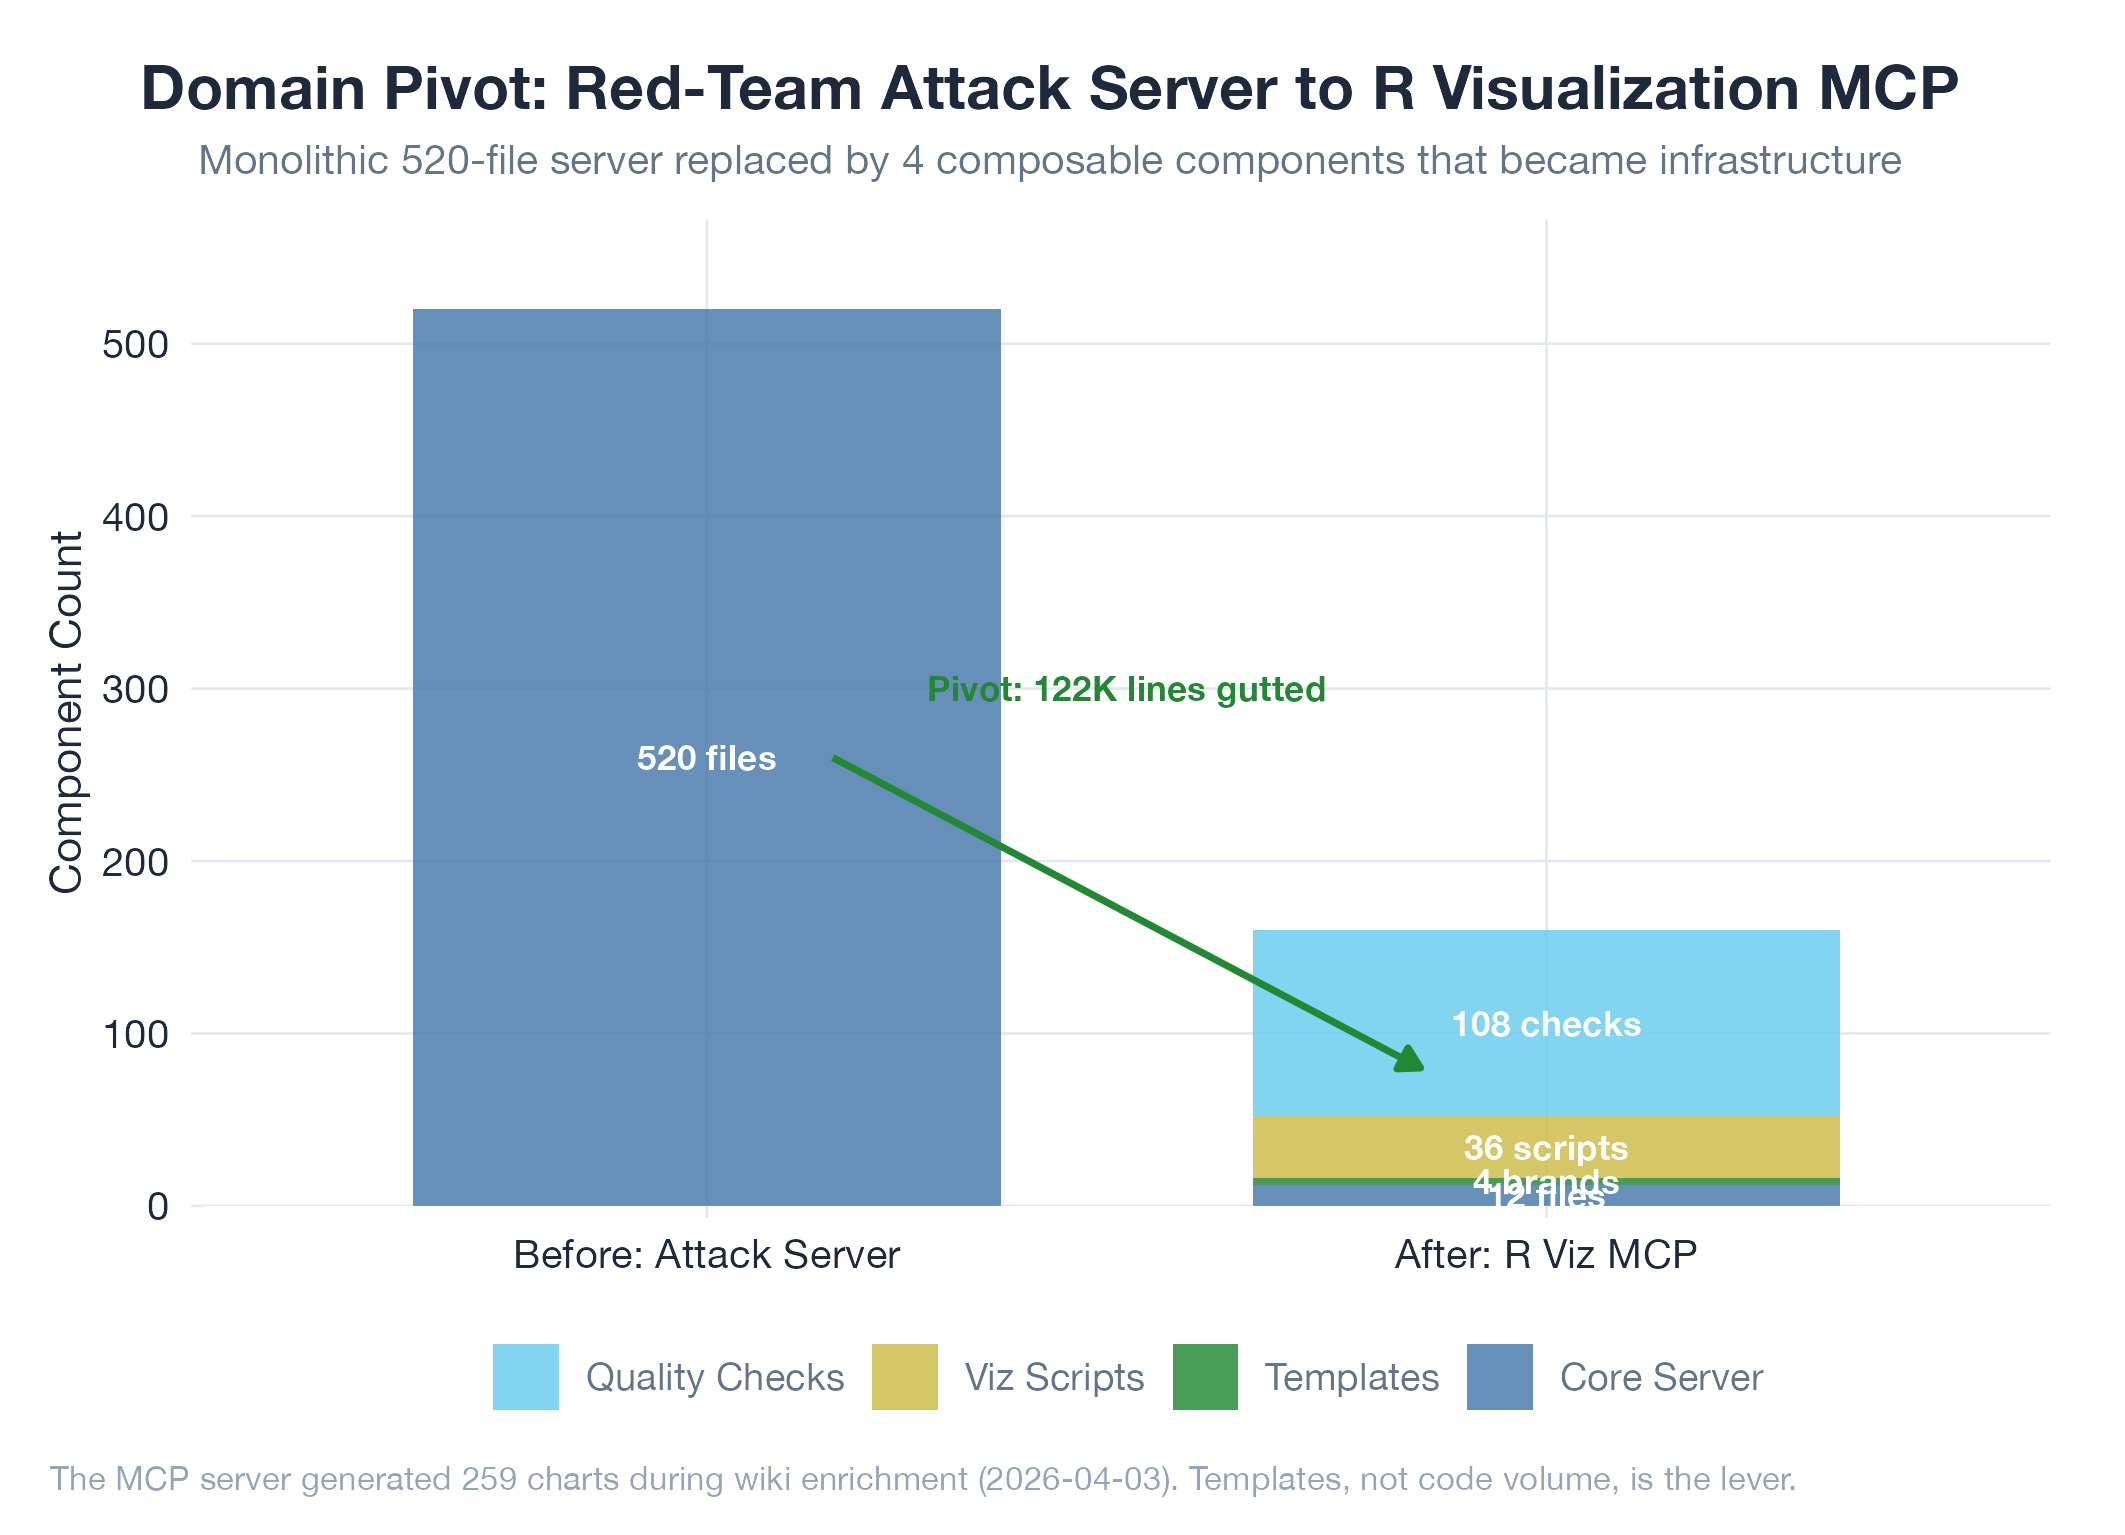
Gutted the entire red-team attack server and replaced it with a purpose-built MCP server for R visualization generation. The new server is a pure context provider : it serves plan sections, prompt templates, example R scripts, and quality checklists via MCP resources/tools/prompts. No API keys needed; the client LLM does all R script generation.
What Changed
4 brand templates (slate, aurora, earth, journal) with custom typography, palettes, and spacing. 36 visualization scripts across 9 chart families (CMP, COM, COR, DST, GEO, NET, STA, SUR, TS). A 108-check quality validator (12 per family). Multi-brand batch renderer. Deployed on Railway with OAuth for Claude web integration.
Why It Matters
This became the foundation for the wiki-visual-enrichment and r-visualization-pipeline skills. The 259 R charts generated during the April 3 wiki enrichment all trace back to the templates and quality system built here. The pivot from red-team to visualization was a domain shift that proved far more useful : the attack server was a dead end, the viz system became infrastructure.